REVIEW OF HMEC CULTURE SYSTEM
Introduction
Index
The following reviews the origins and characterization of the HMEC system developed
in my lab and those of co-workers. This information will be periodically
updated. It includes more than you'll probably ever want to know, but
hopefully, someone will find each tidbit valuable and consequently not need to
query me on that subject. It also includes my personal opinions about HMEC
biology and cell culture usage. (section III. E. 3) I
welcome feedback on how this information can be presented most usefully. Some
of this information was presented in my four Newsletters
from 1987-1989.
To put this information in context, my long-term goal (since 1976!) has been to
develop an HMEC system that could be used to study the normal mechanisms
controlling proliferation and differentiation in human cells, and to understand
how these normal processes become altered as a result of immortal and
malignant transformation. Guiding this work was the desire to facilitate
widespread use of human epithelial cells for molecular and cellular biology
studies, i.e., the hope was that HMEC would seem a reasonable alternative to
fibroblasts, or tumor cell lines, or non-human cells. Therefore, I tried to
develop a system that is relatively easy to use, can provide large quantities
of uniform cell populations, and is relatively well-defined. I realize that
"relatively easy" can be in the eyes of the beholder, and for some
people HMEC will still seem difficult relative to HeLa or 3T3. While HMEC may
require a little more effort, really, they are very easy to grow once you get
the hang of it. What is needed is careful attention to proper tissue culture
procedures, a basic understanding of the cell system, and a "feel for the
organisms". Cells are living creatures, with some resemblance to children
- they can behave as if they have minds of their own. As Dick Ham has often
said, sometimes what is most important is just to "listen to your
cells". The rewards are being able to use cells much closer to relevant
human processes. Normal finite lifespan HMEC allow you to study growth control
in cells with normal human growth control mechanisms.
In developing and promoting the use of the HMEC system, I have been influenced
by the following assumptions: (1) Prior knowledge of what constitutes normal
cell behavior is necessary to determine what constitutes abnormal and deranged
processes, e.g., if you want to say that something you are studying is a
property of a transformed cell, you need also to look at the normal cells. (2)
Understanding normal and aberrant human epithelial cell growth control and
differentiation will ultimately require examination of human epithelial cells.
Non-human and non-epithelial cell studies may provide valuable information and
suggest areas of research. However, the many differences which are known to
exist between these cell types in culture as well as in whole body physiology
indicate that only examination of the cells in question will give an accurate
description of those cells' behavior. I believe this is especially true in the
area of carcinogenesis, where, e.g., major differences in control of telomerase
expression between human and rodent cells result in significant differences in
the transformation process (see Section III.). (3) In a
situation where whole animal experiments are not possible (i.e., with human
cells), the next best option is to develop culture systems that can as
accurately as possible approximate the in vivo state. I have tried to balance
the goal of making the system as amenable as possible to widespread use, with
the goal of trying to optimize the system to reflect in vivo biology. The
result is considerably less than ideal in terms of in vivo approximation.
Normal and aberrant cellular processes in vivo involve complex interactions of
polarized cells within three dimensional organ systems. Single cell types
growing on plastic are not that! Consequently, it's important to remember the
limitations of this culture system. I believe it is valuable that work continue
in developing culture systems that more accurately mimic in vivo cell-cell and
cell-matrix interactions.
Since fostering widespread usage of HMEC has been one of my long-term goals, I
have tried to make cells available to other interested investigators. I have
found it helpful to talk to people individually to understand more precisely
their scientific needs and goals in using HMEC. Checking through the relevant
parts of this web site information first can provide a sense of what is
available and known. While distributing cells is part of what I enjoy doing,
please keep in mind that this is a non-commercial, non-official, personally-run
cell bank, and I and my technician are also doing many other things. I
appreciate it when shipment of cells is made as easy as possible for me.
Nomenclature notes:
"Primary" refers to cells the first time they are placed in culture
(e.g., outgrowths from organoids). Cells which have been subcultured are no
longer primaries and should not be described as primary culture (this is a
common error). I refer to higher passage cultures of normal finite lifespan
HMEC as strains with long-term growth potential in culture. In technical tissue
culture parlance, they could be called cell lines once subcultured, but I find
this usage confusing and only use "cell line" to refer to cells with
indefinite growth potential (i.e., immortal). "Extended life" refers
to cells which grow longer than normal as a result of some abnormal in vitro
exposure; e.g., chemical carcinogens or oncogenes. "Extended life" should
not be used to refer to the HMEC strains with long-term growth since this
growth is normal.
I. Derivation of HMEC Cultures
I. A. Tissue Procurement
Index
We have obtained our human mammary cells from a variety of sources, mostly
surgical discard material. What we refer to as normal HMEC is derived from
reduction mammoplasty tissues. Women undergoing reduction mammoplasty
operations do not have any known epithelial pathology per se (their breasts
contain the same amount of epithelial cells as is present in smaller breasts,
but they have much more adipose tissue). Their breast tissues do show the range
of pathologies generally found in women of the same age (e.g., it may be
described as containing mild to atypical hyperplasia, or fibrocystic disease).
There is always the possibility that women with such large fat deposits in
their breasts could have some abnormality in some aspect of their metabolism.
Because large portions of the breast are removed, with minimal need for
pathology evaluation, considerable quantities of cells from the same individual
are made available from each reduction mammoplasty.
The other major source of tissues comes from mastectomies. Usually the amount
of tumor tissue available for culture is small, due to the need for clinical
evaluation of the tumor. Larger amounts of the non-tumor peripheral tissue is
available. This can be particularly useful in providing matched pairs of tumor
and non-tumor tissue from the same person. However, I do not consider
peripheral mastectomy tissue as normal, as there is always the possibility of
tumor field effects, microtumors within this tissue, field effects from some
environmental conditions predisposing to tumors, and inherent genetic
abnormalities. For some of the same reasons, I would not view as normal the
tissues we have obtained from contralateral mastectomy - tissues removed from
the breast contralateral to a tumor-bearing breast for prophylactic or cosmetic
purposes.
Additional surgical tissues are obtained from benign conditions: fibroadenomas
(which are not thought to be pre-malignant); fibrocystic tissues (which under
some conditions could indicate an increased likelihood of tumor development);
gynecomastias, which are benign hyperplasias in male breast tissue.
We also have a few samples of tissues from other conditions. We have two
subcutaneous mastectomy tissues. These operations are generally performed
because of extensive fibrocystic disease, and in the two samples I processed,
the consistency of the tissue appeared grossly abnormal (hard and fibrous)
compared to reduction mammoplasties. We have two non-tumor peripheral tissues
from breasts that had sarcomas.
Another, non-surgical source of HMEC is from breast fluids. A small number of
cells can be obtained from nipple secretions of around 50% of women, and larger
volumes are available from lactational fluids. Our original publication in 1980
actually utilized cells from nipple secretions. Cells from milk are valuable as
a source of functionally differentiated cells. We have only used these for
specific purposes and do not have supplies to distribute.
I. B. Tissue Processing
(references: Stampfer et al. 1980; Stampfer 1985 - gives procedure details)
Index
Most of the surgically derived tissues are processed by gross selection of
epithelial material followed by digestion for 24-72 hrs at 37ûC with
collagenase and hyaluronidase. This leaves nearly pure epithelial clumps
(termed organoids) which can be separated from the rest of the digested
material by collection on filters with pores of fixed size. The organoids can
be stored frozen in liquid nitrogen (for at least 21 years - the time since I
started this). Material in the filtrate usually contains mainly fibroblastic
type cells, and is a good source of matched fibroblasts from the same
individual.
The small pieces of tumor tissue are generally not structured in organoids.
Digestion for 24 hrs can yield small epithelial clusters and the filtrate may
contain many of the single tumor cells. This method is probably not the best
available for obtaining tumor cells for culture. It is what was used for the
samples that I have stored frozen.
Table 1 gives an idea of what and how many primary tissues we collected and
processed.
Table 1: Bank of Primary HMEC Tissue
|
Tissue Source |
# Specimens |
Age Range |
Median # Ampoules |
|
Reduction Mammoplasty |
49 |
15-66 |
30 |
|
Mastectomy, carcinoma |
57 |
29-93 |
5 |
|
Mastectomy, peripheral non-tumor |
43 |
24-87 |
8 |
|
Mastectomy, contralateral |
6 |
42-77 |
10 |
|
Biopsy (benign tumors) |
9 |
13-47 |
5 |
|
Gynecomastia |
6 |
17-57 |
9 |
This represents the amount of tissues as originally collected, rather than
current inventory levels. We also have the filtrate material for each specimen,
from which, in most cases, fibroblast-like cells can be grown. We are reluctant
to give out much primary material, since quantities are limited and we are no
longer processing these tissues, but small amounts may be available if
essential, particularly from the reduction mammoplasties.
I. C. Media for, and growth of HMEC
(references: Stampfer et al. 1980; Stampfer, 1982; Hammond et al. 1984;
Stampfer 1985)
Index
When I started working with HMEC in 1977, I first developed the MM medium (see Procedures for composition of and growth of
cells in MM). This medium has a 1:1 DME:F12 base, plus conditioned media from
other cell lines, a variety of growth factors, and 0.5% fresh FCS. HMEC
obtained from reduction mammoplasties displayed active growth for 2-5 passages.
The cultures showed a mixed morphology, with larger, flatter non-dividing cells
eventually outnumbering the smaller dividing cells with a cobblestone
morphology. I have also employed a number of variations on the MM theme, e.g.,
with and without a cAMP stimulator (cholera toxin), without the conditioned
medium (designated MM4), or without particular growth factors.
While MM provided only a limited amount of cells, this was sufficient to
perform many types of experiments. It also provided enough cells to begin more
systematic studies on optimizing media for growth of HMEC. This work was done
by Susan Hammond in Dick Ham's laboratory, the result of which was the
development of the serum-free MCDB 170 medium in 1984. This has a base in which
the components have been optimized for HMEC growth, plus a variety of
serum-free supplements (see Procedures
for composition of and growth of cells in MCDB 170). The only undefined element
is bovine pituitary extract. When organoids are placed in MCDB 170, there is
initial active cell division for 2-3 passages of cobblestone appearing cells.
These cells gradually change morphology, becoming larger, flatter, striated,
with irregular edges and reduced proliferative capacity. As these larger cells
cease growth and die, a small (i.e., a 60 mm dish seeded with 1.5 x 10⁵ cells
may show 1-10 areas of active growth) number of cells with the cobblestone
morphology eventually show proliferative capacity and soon dominate the
culture. I have called this process, whereby only a small fraction of the cells
grown in MCDB 170 display long-term growth potential, self-selection. We
now know that the post-selection cells have downregulated expression of the
cyclin dependent kinase inhibitor (CKI) p16. Post-selection cells maintain
growth for an additional 7-24 passages (approximately 45-100 population
doublings in total), depending upon the individual reduction mammoplasty
specimen. At senescence, they appear flatter and more vacuolated, while
retaining the cobblestone epithelial morphology. Self-selection can also be
observed in primary cultures which are subjected to repeated partial
trypsinization, a process wherein approximately 50% of the cells are removed
and the remaining cells allowed to regrow. After about 10 partial
trypsinizations, most of the cells remaining in the dish display the flat,
striated, morphology and cease division. However, nearly every organoid patch
also gives rise to areas of the growing cobblestone cells, indicating a
widespread distribution of the cell type with long-term growth potential. NOTE:
if you are trying to take cells through the self-selection process, dishes with
the large flat cells may sit there for weeks before the smaller cells become
obvious. I suspect that this implies that more is happening than the outgrowth
of a pre-existing p16 non-expressing population, but we have never investigated
this phenomena in depth. NOTE: partial trypsinization is a way to obtain
more good-growing secondary cultures from primary cultures than if the
primaries were fully subcultured. For some reason, the cells in the primaries
remain much more vigorous for a longer time period. Perhaps this is due to some
mixtures in the primary cell population, or some extracellular matrix material
- this question has always intrigued me but it has also never been investigated
in depth.
Most of the normal HMEC which I make available (as well as the commercially
available HMEC from Clonetics) represent these post-selection cells which
display long-term growth in MCDB 170. These cells are particularly useful in
molecular and biochemical studies since they provide a virtually unlimited
supply of uniform batches of normal human epithelial cells. Thus, experiments
can be repeated using cells from both the same frozen batch, as well as from
the same individual. These post-selection cells grow rapidly (doubling times of
18-24 hrs) and will grow clonally with 15-50% colony forming efficiency.
However, it is important to remember that the cells with long-term growth
potential represent a selected subpopulation of the mammary epithelial cells
placed in culture (see below). We have grown a limited number of our frozen
primary organoids specimens in MCDB 170, generating large pools of frozen cells
for use in our laboratory, as well as for distribution to others. We have thus
far grown up cells from 12 reduction mammoplasty tissues, 8 mastectomy tissues
(6 tumor tissues, 5 non-tumor, 1 contralateral), and 1 gynecomastia. Figure 1
illustrates the long-term growth potential of cells from each of these
individuals. NOTE: we have not observed a single instance of spontaneous
escape from senescence in the HMEC grown under these conditions. In general,
cells from the same individual senesced around the same passage, but there were
some exceptions. The following explains how and why we kept track of this
information.
Since the post-selection cells in our large freeze-downs may be derived from a
small number of p16 non-expressing cells, it was possible that a few cell
outgrowths with some unusual quality could influence a given freeze-down pool.
As a consequence, we gradually (and informally) developed a nomenclature to
keep track of the origins of a given cell pool. At the first level, we started
using symbols to indicate every time we started a new primary organoid ampoule
from the same individual. These were easy-to-write symbols with which to label
the dish (e.g., heart ©, infinity ¥, birdie "V", spiral
"@", etc.). These are now officially registered in our computer
records as FreezeDownSymbol (FDS). Subsequently, we realized that it
might be important to also keep track of cell populations coming from different
pools of post-selection cells. Each selection pool can be thought of as a
different substrate "batch", with the possibility that there might be
batch differences. So our FDS may be followed by an indication of "selection"
batch (e.g., ©D, ¥3, @K, @L, etc.). These are the symbols
present in Figure 1. Visually, cells from the same individual, regardless of
batch, tend to have the same characteristic appearance, while we do notice
interindividual morphologic differences (see Figure 2).
NOTE: the most common batch of cells from specimen 184 that I distribute
is @K, which senesces around passage 22, whereas most other batches from
specimen 184 senesce around passage 18.
Figure 1: Growth capacity of HMEC in MCDB170 medium. I stopped adding
information to this graph several years ago, but this gives the general idea
and includes the FDS and selection batch of the cells I most frequently
distribute. You can use this to see the expected passage where the cells
senesce. Primary cultures obtained from reduction mammoplasties (top two rows)
and mastectomies (T= tumor tissue, P= non-tumor tissue from tumor-bearing
breast, C= contralateral) were initiated and subcultured with about 8-10 fold
amplification per passage. Bottom horizontal lines indicate passage level of
initiation of frozen ampoules. Top horizontal lines indicate passage level of
no net increase in cell numbers (i.e., replicative senescence is viable; some
growth does continue as long as cultures are maintained). Internal horizontal
lines indicate that cultures were frozen and reinitiated at that passage. Same
shading indicate cells derived from the same "selection". Asterisks
indicates cells exposed to a cAMP stimulator during selection. For specimen 184
"V", cultures were initiated from the same primary ampoule but taken
through selection with three different cAMP stimulators (cholera toxin,
isoproterenol, prostaglandin E1). In a few cases, (indicated by a different
shading in primary culture), the tumor cultures were grown in MM in primary
culture.
[PS: the names of the symbols shown, in order of appearance, are: 161- heart,
triangle, newmoon, yinyang, infinity; 184- birdie, spiral (not shown are aleph,
cross, lollipop, ecology; flower); 48- silver, orange, pink (not shown are
blue, tulip); 172- icecream, lollipop, diamond; 195L- teardrop, pumpkin; 186T-
heartbrk, sunrise]
Other information which may be gleaned from these data: (1) There does not
appear to be any loss in viability due to multiple freeze-thaws; (2) There does
not appear to be any correlation between growth potential in culture and age of
specimen donor. It is possible that some of the differences seen in growth
potential could reflect interindividual differences in optimal growth
requirements relative to the nutritional formulation of MCDB 170.
Figure 2 :Morphology of reduction mammoplasty derived HMEC grown in MCDB
170.
Giemsa stained cultures from
(A) 184 p7; (top image)
(B) 172 p13; (middle image)
(C) 161 p9; (bottom image)
I. D. Characterization of Tissue-derived HMEC
(references: Taylor-Papadimitriou et al., 1989, Stampfer & Yaswen, 1992)
Index
Since a main goal of studying cells in vitro is to gain understanding of in
vivo processes, we have considered it extremely important to characterize the
HMEC grown in culture with reference to what is known about human mammary cells
in the body. Unlike other organ systems, HMEC in culture (with the exception of
lactational fluids and very rare surgical specimens) are not obtained from
functionally differentiated tissues (i.e., pregnant, lactating, involuting).
Consequently, we have not put much effort into examining these cells for
features of functional differentiation. The cells we distribute, growing under
standard culture conditions, do not express a-lactalbumin
or ß-casein. We have instead focused on
the type of differentiation we termed "maturation", referring to the
developmental history of a cell from a proliferative stem cell population to a
cell with diminished reproductive capacity to a "terminally differentiated"
cell no longer capable of division. We have been particularly interested in
this pathway because human breast tumor cells in vivo and tumor derived cell
lines almost uniformly express the phenotype of the most mature normal HMEC in
vivo.
The mammary gland consists of pseudostratified epithelia, with a basal layer
resting upon a basement membrane and an apical layer facing the lumen of the
ducts and alveoli. The basal layer of cells does not contact the lumen, whereas
the apical layer may contact the basement membrane as well as the lumen. Apical
cells display a polarized morphology, with microvilli at the luminal side. The
myoepithelial cells, which contain muscle-like myofilaments, and which contract
upon appropriate hormonal stimuli to cause expulsion of milk, lie in the basal
layer of cells. Based upon examination of keratin expression and other marker
antigens, it has been proposed for the rodent mammary gland that a stem cell
population capable of differentiating into both myoepithelial cells and the
apical glandular epithelial cells, also resides in the basal cell layer. The
actual maturation lineage of human mammary epithelial cells in vivo has not
been clearly defined. Based on the rodent mammary gland, and other epithelial
tissues, it is reasonable to hypothesize that the most proliferative epithelial
population in vivo lies in the basal layer, or intermediate between basal and
luminal layers. Conversely, the luminal cells presumably have reduced
proliferative capacity, with the most mature and least proliferative cells
being those shed into the lumen (and recovered in nipple aspirations and milk
fluids). NOTE: I do not equate basal cells with myoepithelial cells,
which are specialized differentiated contractile cells. Myoepithelial cells may
all be basal, but not all basal cells are myoepithelial. Unless one can
demonstrate the presence of myofilaments, I do not think a cell should be
referred to as myoepithelial.
A variety of studies from Joyce Taylor-Papamidritriou's group and others (see
references at end) have defined properties which can be used to distinguish
basal vs. luminal human breast cells, cells during lactation, and tumor cells.
In general, mammary basal cells, similar to basal cells in stratified tissues
such as the skin, express keratins 5 and 14. a-actin is present and the
calmodulin-like protein (CLP) is preferentially found in the basal cell layer.
A subpopulation expresses the common mesenchymal intermediate filament,
vimentin. Luminal cells express the keratins 8 and 18 found in simple epithelia
like the lung; keratin 19 shows variable expression and the 19 positive cells
probably represent the most mature population. In culture, keratin 19
expressing cells display very little proliferative potential. Expression of
specific epitopes of a polymorphic epithelial mucin (PEM) is localized to
luminal cells in vivo. Cells in the resting gland are weakly PEM positive,
whereas cells from lactating glands may express higher levels of specific mucin
epitopes. Like keratin 19, high expression of specific PEM epitopes has been
correlated with a low proliferative potential in milk derived HMEC in vitro.
Only a small fraction (~3-10%) of normal HMEC in vivo show detectable estrogen
receptor, and this positive population is preferentially localized in the
non-basal layer. It is not clear that the mammary gland contains cells which
are terminally differentiated, such as those in the most mature layers of
stratified epithelium, since even keratin 19, PEM positive cells have a limited
capacity for cell division in vitro.
Unlike what one might intuitively expect, and unlike stratified epithelial
tissues, breast tumor cells in vivo and tumor cell lines in vitro almost all
have the phenotype of the most mature luminal cell - positive for keratins 19,
8/18, high expression of several PEM epitopes, including those found in the
differentiated lactating cells, negative for keratins 5/14, and CLP. The
consistency of tumor expression of keratin 19 has been utilized to locate
micrometastases in lymph nodes. As normal HMEC with this phenotype show little
or no growth in culture, I think this tumor cell phenotype is indicative of
some aspect of derangement in growth control. Most tumors also initially have
high expression of estrogen receptor, and most are initially negative for
vimentin expression, although vimentin is seen in a subset of estrogen receptor
negative breast tumor cell lines and tissues. I don't know of a definitive
explanation for this tumor cell phenotype, nor has the maturation state of the
tumor cell precursor in vivo been clearly established. Benign proliferative
tumors and some in situ carcinomas contain keratin 19 negative cells, so a
keratin 8/18 positive, 19 negative cell could be the precursor of invasive
breast tumors. If so, expression of the keratin 19 and high PEM phenotype in
invasive tumors may be a consequence of malignant transformation.
In collaboration with others, we have examined the HMEC grown under our culture
conditions for expression of the above phenotypic markers. Primary cultures of
normal HMEC grown in MCDB 170 and early passage cultures grown in MM are
heterogeneous. Some cells have the basal phenotype: keratin 5/14 positive, PEM
negative, and vimentin, CLP and a-actin
positive; other cells show the luminal phenotype: keratin 5/14 negative,
keratin 8/18/19 positive, PEM positive; and some are in-between (e.g., keratins
5/14/8/18 positive). The cells which initially proliferate in MCDB 170 medium
have the basal phenotype. However, post-selection cells begin to express some luminal
markers, i. e., keratins 8 and 18 and some PEM epitopes. Expression of these
luminal properties increases with continued passage in culture, such that the
senescent cells uniformly express these markers. At the same time, expression
of the basal keratins 5/14, CLP, and vimentin is not lost. We have not detected
keratin 19 or estrogen receptor in the post-selection population. All HMEC
examined derived from normal tissues have shown a normal karyotype.
The above results led us to propose that the cells which display long term
growth in the serum-free MCDB 170 represent a multipotent stem cell population
initially present in the basal layer of the gland. With increasing time in
culture, these cells show a partial differentiation towards the luminal phenotype.
However, it is a possibility that culture conditions have induced some
artifactual phenotypic expression. In particular, growth of cells on
impermeable plastic substrates prevents the normal cell-extracellular matrix
contacts and precludes the normal development of cellular polarity. Although we
now know that the post-selection cells have p16 promoter methylation and no p16
expression, we still do not know if this represents a normal cellular process
or an in vitro artifact. NOTE: The post-selection cells in MCDB 170
represent a limited phenotype. While they represent a wonderful normal human
epithelial finite lifespan cell with which to study questions of growth
control, for some experimental purposes, these may not be the best cell types
to use. Cells grown in MM type media show the range of in vivo phenotypes.
However, they have a much more limited lifespan and we have less of them to
distribute. Additionally, although they contain keratin 19 positive cells,
these are not the actively dividing cells in the population.
II. In Vitro Transformation of HMEC
II. A. Derivation of Cell Lines 184A1 and 184B5, and
Extended Life Cultures
(references: Stampfer & Bartley, 1985; Stampfer & Bartley, 1988; Walen
& Stampfer, 1989)
Index
One of my main goals in developing a culture system for normal HMEC was to use
the normal cells as a basis for in vitro transformation, so that different
stages of malignant progression could be compared using cells from one
individual. I was interested in using a chemical carcinogen as the agent for
transformation because: (1) I wanted to induce random errors; (2) there was a
lot of data indicating polycyclic aromatic hydrocarbons (PAH) were good
inducers of mammary cancer in rodents, and I wondered if the same could be true
for humans; (3) chemicals seemed easier to use than radiation; (4) we performed
a series of experiments indicating that HMEC were very efficient at converting
PAH procarcinogens to their active form (see section VI. A.).
Three sets of experiments were performed in the early 1980's using primary
cultures from normal HMEC specimen 184 organoids. The three separate original
cultures had the FreezeDownSymbols: "aleph"(A), "cross"(C),
and "birdie"(B). In each case, cells in at least 2 T-25s were treated
for 2 or 3 24 hr periods with 1-2 µg/ml of benzo(a)pyrene (BaP), (a
concentration that gave 80% killing) and 2 T-25s were treated as controls. The
cells were grown in MM medium, in which 184 normally stops growing by 5th
passage. We followed the fate of the treated and control cells both in primary
culture (how long growth was maintained in the primary T-25 flasks) and after
subculture (the primary flasks were partially trypsinized many times, and after
some trypsinizations the removed cells plated and passaged until growth
ceased).
Figure 3. shows the fate of these cells and indicates the nomenclature we used
to identify Extended Life (EL) cultures and the immortally transformed cell
lines. We gave a number to each of the subcultures we passaged in experiments C
(cross) and B (birdie); i.e., the B1, B2, B3 etc. that you see in the figure.
The EL cultures (i.e., treated cells that kept growing after the controls had
stopped growing) derived from each of these subcultures were given the
alphabetical equivalent to these numbers, e.g., B5 = Be, C2 = Cb. The
immortally transformed lines that developed were given the subculture name,
i.e., B5 and A1. We have extremely limited frozen stocks for some of these EL
cultures. Subsequently, we grew some of these MM derived EL cultures in MCDB
170, which we found permitted growth for an additional 2-5 passages. Still, we
have very limited stocks of EL cells so we're hesitant to distribute them. We
would consider specific cases of collaboration or mutual interest, so check
with me. The EL cells were notable for their heterogeneity with respect to
morphology and growth potential (see Figure 4). Growth
often followed a punctuated pattern, with outgrowth (lasting 1-5 passages) of
individual patches or colonies within non-growing populations. NOTE: we
now know that all of these EL cultures tested do not express p16. In only one
case, 184Aa, is this due to a detectable mutation. We surmise that in MCDB 170,
some cells can spontaneously downregulate p16, while in MM, some cells can
downregulation p16 after carcinogen exposure, but rarely if at all
spontaneously. Thus, although these carcinogen treated cells are called EL -
this is in relation to MM grown controls. When grown in MCDB 170, EL and
post-selection cells cease growth at approximately the same telomere length. NOTE:
most, though not all, of the EL cells had morphologies/growth patterns clearly
distinct from anything in the untreated populations. I suspect this implies
something about changes which have occurred, which could affect cell-cell or
cell-matrix interactions.
Figure 3. Growth of BaP treated specimen 184 in MM. It was conveniently
fortuitous that the FDSs chosen for these three experiments started with the
first three letters of the alphabet. When published, I presented them in the
order A, B, C so it would look intentionally linear, but the actual order of
the experiments was A, C, B and their real names are aleph, cross, birdie. The
figure follows the fate of the treated (T) and control (C) cells in primary
culture and upon subculture. Since several dishes were plated at each
subculture, and if growing, their lineages followed independently, more than
one kind of growth pattern could be observed at a given passage level. In
experiment 184C, cholera toxin was inadvertently omitted from the medium until
22 days after seeding (p5 of subculture C1, p4 of C2, p3 of C3).
Click here to see figures 4a-d
Figure 4. Morphology of EL cultures, Giemsa stained.
(A) 184C p8 with mixed growing and non-growing
cells throughout the dish;
(B) 184C p6 containing two focal growing areas,
one with uniform growth (shown) and one with mixed growing and non-growing
cells (not-shown);
(C) 184B p6 with non-growing and actively
growing cells in a "hyperplasia" morphologic pattern;
(D) 184C p7 with swirly thumbprint morphology.
184Aa had almost exactly the same appearance when it first showed up as a
single patch in 184A p5;
Eventually, almost every EL cell ceased growth. The two exceptions were the
appearance of the 184A1 line from the 9th passage 184Aa EL population, and
184B5 from the 6th passage 184Be. 184A1 stood out as a more refractile
appearing cell growing more vigorously as "eye-shaped" singlets,
compared to the patchier, flatter, less vigorous 184Aa (which died by passage
11). Some cells were transferred to MCDB 170 medium at passage 11 and carried
continuously in that medium to passage 105. Cells were also maintained in MM up
to passage 69. 184B5 was a sickly looking small tight patch, somewhat more
refractile than 184Be, very slow growing, that strongly caught my attention for
undefinable reasons. It was first transferred to MCDB 170 at passage 9 and
grown to passage 101. Cells maintained in MM were grown to passage 30. It is
curious and perhaps indicative of some underlying structure that the first time
I saw both these cells, I was sure they were transformed, and I did not have
that sense with any other cells in the EL cultures.
Both of these lines show specific clonal karyotypic aberrations, indicating their
independent origins from a single cell. Some of the karyotypic abnormalities
found in 184B5, e.g., 1q22 breaks and tetrasomy for 1q, are also frequently
observed in cells obtained from breast tumors. Upon continued passage in
culture, these two lines show some genetic drift (more so in 184B5 than 184A1),
but it is relatively minimal compared to that observed in most human breast
tumor cell lines. Even at passage 41, 184B5 has clearly identifiable
chromosomes and a near pseudodiploid karyotype. Thus, the vast majority of the
cell population would be expected to remain karyotypically stable when studied
over the course of a few passages in culture, yet the presence of some genetic
drift could give rise to rare variants in the cell population. Although 184A1
and 184B5 have an indefinite lifespan, they do not have properties associated
with malignant transformation. They do not form tumors in nude mice and they do
not express a sustained capacity for anchorage independent growth (AIG),
although 184B5 can show a low level of random colony formation. 184B5 has a
distinctive morphology, growing in tightly packed patches. An advantage of this
is that the fate of single cells can easily be followed without needing to seed
at clonal densities (the progeny of a single cell stay attached and make a
colony). Early passage conditionally immortal 184A1 cells (see Section
III) grew with minimal cell-cell contact at low densities, and showed some
morphologic heterogeneity, with the presence of large vacuolated cells. At
higher passages, when converted to full immortality, the growth pattern shows
more cell-cell association and patchy growth, with few vacuolated cells visible
(see Figure 5 and discussion the of conversion process in section
III). Since 184A1 and 184B5 are cell lines of indefinite lifespan, I have
unlimited supplies to distribute.
Click here to see figures 5a-d
Figure 5: Morphology of 184A1 and 184B5, Giemsa stained.
All pictures shown at the same magnification.
(A)184 p9 in MCDB 170;
(B)184A1 p15 in MCDB 170; note the large
vacuolated cells;
(C)184A1 p42 in MCDB 170;
(D)184B5 p11 in MCDB 170.
CAUTIONARY NOTE: We were remiss in our earliest tissue culture years in
not routinely checking all cells for PPLO contamination. We first started
routinely testing for PPLO in 1982, after experiments "A",
"C" and "B" were initiated, and the cell lines 184A1 and
184B5 were being maintained in MCDB 170. These lines, as well as other normal
and benzo(a)pyrene treated extended life cells growing in MCDB 170, were tested
for PPLO by Hoechst stain and growth in agar broth. The results were all
negative. About a year later, we took out some of our frozen extended life
benzo(a)pyrene treated cells, and placed them in MM. Now our routine Hoechst
stain test showed some of them to have foreign DNA, although broth growth was
still negative. Transfer of the samples to MCDB 170 generally led to loss of
the Hoechst stain positive material within 2 passages. This negative phenotype
was retained after transfer back to MM. Two (visually equivalent Hoechst stain
positive) samples were sent to Microbiological Associates for assay by agar
growth, Hoechst, and strain-specific antibodies. They reported one to be
completely negative and the other positive for M.hyorhinis (which doesn't grow
in the usual agar broth assay). From our Hoechst stain results, it appears that
184Aa, the EL precursor of 184A1, was positive, while some, but not all of
184Be, the EL precursor of 184B5, may have been positive. We can not say
whether this may, or may not, have affected any results. By the Hoechst and
Mycotect assay, our current normal HMEC, EL, 184A1, and 184B5 are negative. It
was a mistake for us not to have been testing our cells. A take-home message is
to be careful to check your cells on a regular basis.
II. B. Derivation of Variants of 184A1 and 184B5
(references Clark et al., 1988; Stampfer & Yaswen, 1992)
Index
One of my original goals for in vitro transformation of HMEC was to obtain
malignant transformants from normal HMEC. To be honest, somewhere along the
line I realized that although this was important science, I myself was less
than enthusiastic about creating malignant cells from normal, and the
immortally transformed cells were sufficient for my scientific curiosity (or as
I commented, as I got older, the question of immortality seemed more
interesting than malignancy). Nonetheless, I did try (and not succeed) to
obtain malignancy by exposing the 184A1 and 184B5 lines to further chemical
carcinogens, in this case, the direct acting carcinogen, N-nitroso-ethyl-urea
(ENU). Others exposed the lines to specific oncogenes, which could lead to
cells that were AIG and/or made tumors in nude mice. As part of this work, I
analyzed the cells for their nutritional requirements and isolated/developed
cell variants with altered nutritional requirements. The history of these
studies and the names/origin of these variants is described below.
II. B. 1. Nutritional Variants
Index
Nomenclature Note: Where spontaneously occurring subpopulations were
isolated based on the nutritional composition of the medium, they are
designated as A1N... and B5N.... In the case of MM grown
subpopulations, the N is followed by a (arbitrary) number; in the case of
MCDB170 grown cells, the N is followed by letters indicating what factors were
no longer required. Nutritional variants obtained following exposure to ENU are
designated A1ZN... and B5ZN... followed by letters indicating the
non-required factors. While I sometimes refer to these nutritional variants by
their complete names (e.g.., 184A1N4), for brevity and simplicity sake, it's OK
to officially refer to them without the 184 prefix.
The first nutritional variants were isolated (in a non too systematic fashion)
from 184A1 growing in MM medium. For general purposes, the only one of these to
note is 184A1N4. 184A1 was seeded at p16 in MM minus the conditioned
media and without cholera toxin. Attachment appeared poor but the few patches
that were present grew fairly well. After 3 passages, there appeared to be
uniform good growth and attachment. These cells were first transferred to MCDB
170 at p28. The karyology of A1N4 indicated that, unlike the pseudodiploid
184A1, A1N4 were aneuploid (near triploid) with only one additional chromosomal
marker beyond the 4 seen in the parental 184A1 cells. It is therefore likely
that, although not cloned, they represent a clonal population. The A1N4 were
used by Robin Clark for malignant transformation with oncogenes.
More systematic isolation of nutritional variants was done in MCDB 170 medium.
The existing literature indicates that many transformed cells show reduced
nutritional requirements. As part of our initial characterizations of the
immortally transformed cell lines, we first compared the requirements of 184,
184A1, and 184B5 for the individual growth factors present in MCDB 170 for
short term growth, for long-term culture, and in clonal vs. mass culture (Table
2 and list below). 184A1 and 184B5 showed a few differences from each other and
normal HMEC. Both were more dependent upon EGF for growth in mass culture
(although EGF independent variants could be isolated) whereas the normal cells
could continue to proliferate without EGF (see section III.).
All of these HMEC showed a stringent requirement for EGF in clonal culture.
184A1 showed little effect upon removal of hydrocortisone (HC); 184B5 and 184
had greater short-term requirements. All the HMEC had a requirement for BPE for
short-term growth. In the long-term experiments, removal of HC or BPE from mass
cultures of normal HMEC led to cessation of growth over the course of 1 to 3
passages. Removal of insulin (I) did not prevent continued proliferation, but
led to slower growth, a less healthy appearing culture, and earlier senescence.
Removal of I from 184A1 and 184B5 also did not prevent continued growth. For
more details of the long-term experiments with the cell lines, see the list
below. These nutritional variants are available for distribution. My general
conclusion from these studies is that 184A1 and 184B5 retain basically normal
growth factor dependence (except for 184A1 and HC).
Table 2. Growth Factor Requirements of Normal and Transformed HMEC in MCDB170
|
|
Percentage of Control Cell Growth |
|||||
|
|
184 |
184A1 |
184B5 |
|||
|
Medium |
MC |
CFE |
MC |
CFE |
MC |
CFE |
|
Complete MCDB 170+IP |
100 |
100 |
100 |
100 |
100 |
100 |
|
minus I |
49 |
47 |
11 |
18 |
26 |
73 |
|
minus HC |
36 |
32 |
84 |
88 |
18 |
61 |
|
minus EGF |
86 |
2 |
20 |
0 |
12 |
0 |
|
minus BPE |
15 |
21 |
21 |
24 |
16 |
75 |
Abbreviations used:
I, insulin;
HC, hydrocortisone;
EGF, epidermal growth factor;
BPE, bovine pituitary extract;
IP, isoproterenol;
MC, mass culture growth;
CFE, colony forming efficiency.
Cells from specimen 184 (p11), and cell lines 184A1 and 184B5 (passages 17-20)
were grown in complete MCDB 170 with isoproterenol. For mass culture, cells
were subcultured into duplicate 35 mm dishes (5 x 10⁴ per dish) in the
indicated media. When control cultures were subconfluent or just confluent, all
the cultures were trypsinized and the cells counted by hemocytometer. For
clonal cultures, single cells (100-1000) were seeded into triplicate 100 mm
dishes. After 10-14 days, cells were stained with Giemsa and colonies greater
than 30 cells counted.
List of Spontaneous Nutritional Variants:
184A1:
CAUTION: the nutritional requirement studies were done with 184A1 at
passages £ 20 and the selection for
variants was done with 184A1 around passages 27-32. We now know that these are
non-homogeneous conditionally immortal populations (see section
III) The results might be different if later passage fully immortal cells
were used.
184A1NE: no EGF. For the first 2 passages, growth was slow and selective
(a small # of patches). The growth rate was the same as control (+EGF) after 4
passages.
184A1NH: no HC. Slow patchy growth for first passage; growth normal
after 2 passages.
184A1NI: no I. Growth was initially slowed, but less selective than
-EGF; the cells looked good. Growth rates were normal within 2-4 passages.
184A1NB: no BPE. Little initial growth. Eventually a few patches grew
out. After one additional passage the resultant cells grew normally.
184B5:
184B5NE: no EGF. Media first changed at p48. Growth initially slower and
selective. It took 7 passages to select a population that looked good and had a
normal growth rate. Repeated with cells at p36, after 3 passages of slow,
selective growth a good growing population arose.
184B5NH: no HC. Media changed at p34. Growth initially slower but normal
after 2 passages.
184B5NI: no I. Media changed at p35. Growth initially slowed but not as
selective as -EGF. Growth rates were normal within 4-6 passages.
184B5NB: no BPE. Growth initially slow and selective but not as extreme
as 184A1 -BPE. Cells didn't look good and grow normally until after 6 passages.
184B5NIB: no I or BPE. 184B5NB cells were switched at p42 to media
without insulin. They grew initially slowly and poorly. Good patches were
obvious after 2 passages and growth was normal after 3 passages.
We next examined the effect of removal of multiple growth factors to determine
conditions where untreated 184A1 and 184B5 did not yield spontaneous
nutritional variants. These were defined as removal of I and EGF, I and BPE, or
EGF and BPE for 184A1, and removal of I and EGF, or I and BPE for 184B5.
Populations of 184A1 and 184B5 were then tested for their ability to grow in
these restrictive media after exposure to ENU concentrations that yielded 80%
inhibition of colony forming efficiency (1500 µg/ml for 184A1 and 750 µg/ml for
184B5). Two T-75 flasks each of treated and control cells were exposed to ENU
or solvent alone for 2 or 3 consecutive passages. Under a few conditions the
ENU treated cells were capable of sustained growth whereas the untreated cell
lines quickly ceased growth. The resulting growth factor independent variants
may represent a further step in malignant progression. However, they did not
show AIG or form tumors in nude mice.
List of ENU-induced Nutritional Variants:
184A1ZNEB: selected in MCDB170 -EGF-BPE. The treated cells had a fair
amount of growth (compared to almost nothing in the controls), but most of this
faded away after several passages. In one experiment, cells with patchy
vigorous growth and a distinctive morphology quickly took over the population,
and maintained active growth in this medium. Although not examined, these are
presumably clonal.
184B5ZNEI: selected in MCDB170 -EGF-I. The treated cells showed initial
widespread, morphologically heterogeneous, growth (compared to very little in
the controls). Most of this growth faded after about 5 subcultures but in
several cultures growth was maintained. The morphologies are not particularly
distinctive and we don't know if these represent clonal cultures.
These variants are available for distribution. For more information on the
non-EGF requiring variants, see Figure 7.
II. B. 2. Oncogene Exposed Derivatives
(early studies) (references Clark et al., 1988; Stampfer & Yaswen, 1992;
Frittitta et al., 1995)
Index
AIG and malignant derivatives of 184A1 and 184B5 were initially obtained with
the use of oncogene containing retroviral vectors and viruses, and
transfection. In the case of 184A1, A1N4, a clonal derivative with reduced
nutritional requirements, was exposed by Robin Clark to the genes for SV40
large T antigen, v-H-ras, and v-mos, singly and in combination. The combination
of H-ras and SV40-T led to cells (designated A1N4-TH) which formed
progressively growing tumors in nude mice and showed AIG. Exposure to v-H-ras (A1N4-H)
or v-mos (A1N4-M) alone led to cells that produced tumors with reduced
frequency and longer latency. SV40-T alone (A1N4-T) did not yield
tumorigenic cells, but did affect the growth factor requirements for anchorage
dependent and independent growth. In all cases of oncogene exposure, the
resultant cells were capable of proliferation in media that did not support the
growth of the parental A1N4 cells. A1N4-TH has a near tetraploid karyotype,
which is missing the A1N4 chromosomal marker and contains only one additional
clonal chromosomal aberration relative to 184A1. Thus even the malignantly
transformed cell line, containing v-H-ras, does not show a very unstable
karyotype in terms of gross chromosomal aberrations.
The 184B5 cell line was exposed to v-K-ras (designated 184B5-K) by Paul
Arnstein, yielding cells which were tumorigenic in nude mice, with short
latency. However, these tumors did not grow beyond approximately 5 cm diameter.
Most of our studies have utilized the culture designated 184B5-KTu,
which was derived from a B5-K tumor resected from a nude mouse and replaced in
culture. B5-K and B5KTu do not display AIG.
Although we have some stocks of these cells available, we are not eager to be
growing or distributing these cells, as the infection was with non-defective
retroviruses. If you really want oncogene exposed 184A1 or 184B5, I suggest you
transfect the cells with the oncogenes of your choice. We do now have available
184A1 infected, using defective retroviral vectors, with HPV16 -E6, -E7, or
SV40T (see Section III. B.) Alternatively, other
investigators may have already infected the cells with your oncogene of choice,
and you may query for this information (see Investigator
List).
184B5 has also been exposed to transfection with erbB-2, mutated erbB-2, and
the insulin receptor. ErbB-2 alone (184B5-E) made the cells capable of
AIG (~5-15%, large colonies), while mutated erbB-2 additionally made them
capable of tumor formation in nude mice. Overexpression of the insulin receptor
also made the cells capable of some AIG. We can make available our stocks of
184B5-E.
II. C. Characterization of 184A1, 184B5, and derivatives
(references: Stampfer & Bartley, 1985; Stampfer & Yaswen, 1992;
Stampfer & Yaswen, 1993; Sanford et al. 1992; Lehman et al. 1993; Thompson
et al. 1994; Sandhu et al. 1997; Brenner et al. 1998)
Index
Differentiation/maturation markers: In general, 184A1 and 184B5 have a somewhat
more mature phenotype than finite lifespan 184. However, it is important to
recall that these lines were derived from cells grown in MM medium, which
contains cells with phenotypes more mature than basal. We don't know the cell
of origin of the EL 184Aa and 184Be precursors to these lines. Both lines
maintain some expression of keratins 5 and 14, but at significantly decreased
levels, while expression of keratin 18 is increased relative to normal
post-selection 184 HMEC. Both lines have barely detectable levels of vimentin.
184B5 strongly expresses the luminal and tumor associated PEM antigens, while
184A1 has some but lower expression of PEM. The tumorigenic transformants,
A1N4-TH and B5-KTu have very low levels of keratin 5 and increased levels of
keratin 18. While B5-KTu remains vimentin negative, the A1N4-TH cells show re-expression
of vimentin. We have not been able to detect keratin 19 or estrogen receptor in
any of these lines. Thus none of these lines fully resembles the tumor cell in
vivo, and the phenotypic differences between the immortal lines and MCDB 170
grown 184 HMEC may just reflect maturation states (i.e., not be related to the
immortalization process). Like normal proliferative HMEC, they are keratin 19
negative.
Fibronectin represents about 10-20% of the protein secreted by normal HMEC in
culture. In many transformed cells, the level of fibronectin mRNA and protein
synthesis is decreased. Expression of fibronectin is greatly reduced in 184A1
and to a lesser extent in 184B5. However, we do not know if fibronectin
secretion would normally be lower in HMEC with a more mature phenotype.
Upregulation of fibronectin synthesis by TGFß
remains normal in both cell lines (see section V).
Another approach we took to characterize differences between our normal and
transformed HMEC cultures was to use subtractive hybridization to identify
genes expressed in the normal HMEC, but downregulated in the immortal and
malignantly transformed cells. This was how we first isolated and identified
CLP (see section VI. B. for more), and observed the
difference in expression of keratin 5, vimentin, and fibronectin
The normal and transformed HMEC have also been characterized with respect to
both their growth patterns and their gene expression when placed on
reconstituted basement membrane material derived from the Englebreth-Holm-Swarm
(EHS) murine sarcoma, which has been shown to support increased differentiated
functions of a variety of cell types. Normal HMEC are capable of forming
three-dimensional structures with striking resemblance to endbuds in intact
mammary gland tissue, whereas 184A1 displays only less developed structures and
184B5 forms only small clusters. The A1N4-TH cells show even less structure
formation than 184A1 and the B5-KTu cells resemble 184B5. We have not examined
the underlying basis for these differences, and suspect that alterations in
cell-cell connections may be involved. E-Cadherin is expressed by all of these
cells with the exception of the aggressively tumorigenic A1N4-TH cells.
Malignancy associated markers: As mentioned earlier, neither 184A1 and
184B5 shows AIG or tumorigenicity, and they retain mostly normal growth factor
dependence. They do differ from normal HMEC in having some karyotypic
abnormalities. 184B5 has been shown to have a 10x higher rate of mutations at
the HPRT locus than normal HMEC, reduced intercellular communication, and
reduced DNA repair during the G2 phase. The ability of 184A1 and 184B5 to gain
AIG and to be malignantly transformed when exposed to specific oncogenes also
differs from normal HMEC.
No differences in expression or regulation of the RB protein have been detected
in 184A1 or 184B5. No differences in sequence or expression of p53, or p53
dependent genes, has been seen in 184A1 or 184B5 relative to normal HMEC.
However, we and others have shown that the p53 expressed by the post-selection,
EL, and immortally transformed cultured HMEC (but not the p53 in cultured
fibroblasts from the same person) is in a conformation recognized by antibodies
that recognize mutant p53, and the half-life of the p53 protein is 3-4 hrs. We
do not know the functional significance of the presence of this stabilized form
of p53 in these cells. I do note that the presence of stable p53 correlates
exactly with the cell types which do not express p16, and wonder if there is
some causal basis for this association. The absence of p16 in 184A1, as in
184Aa, is due to mutations in both p16 alleles. In 184B5, as in post-selection
HMEC, the p16 promoter is methylated. The loss of p16 expression in this system
(which retains normal RB) may therefore facilitate immortal transformation, but
is by itself insufficient. Thus these cell lines, while immortally transformed,
do not express markers of invasive or malignant transformation, and are therefore
useful in studying the process of immortal transformation per se, without many
other potentially confounding factors. In comparison to almost all other
existing immortal lines, they are also valuable as minimally deviant immortally
transformed cells. Our recent studies have focused on elucidating the
immortalization specific changes (see below).
III. The Conversion Process during HMEC Immortalization
(references Stampfer et al., 1997; Garbe et al., 1999; Nijjar et al., 1999;
Stampfer et al., in prep., Hosobuchi & Stampfer, 1989)
III. A. Conversion of p53+/+ 184A1, and 184B5
Index
When 184A1 and 184B5 were initially characterized back in 1982-3, we observed
two growth patterns with no obvious mechanistic explanations:
(1) Although both immortal lines maintained continuous growth in mass culture
following their initial emergence, slow, non-uniform growth occurred during the
first 20-30 passages. As mentioned above, 184B5 first appeared as a sickly slow
growing patch. It continued to grow slowly, with a gradually increased
proliferative rate, until it achieved fairly rapid growth by passage 30. Visual
observation of the colonial outgrowths indicated that many cells didn't grow,
or that colonies stopped growth at small sizes. Early passages of 184A1 also
contained many vacuolated and non-proliferative cells. Back in the 1980's, not
being able to think of a mechanistic explanation for why so many individual
cells of immortal cell lines were dying, I chose to ignore this problem and only
gave out higher passages of these lines, where growth was more uniform (>p30
for 184A1 and >p25 for 184B5). But this bothered me.
(2) While I could pretend to ignore the above problem, the response of these
cells to the pleiotropic cytokine TGFß
was too odd to ignore, and it was this in-my-face puzzle that led me to start
unraveling the conversion process (see more about TGFß in Section V.).
We have not observed any finite lifespan HMEC able to maintain continuous
growth in the presence of TGFß, although
cells that have undergone fewer population doublings (PD) in culture could
undergo 5-10 additional PD before complete cessation of growth, and early
passage HMEC from specimen 48 were able to maintain some for 8 weeks. Cells
closer to senescence stopped growth within 1-2 PD. In contrast, populations of
184A1 and 184B5 which maintained growth in TGFß
could be isolated. However, the pattern of resistance to TGFß-induced growth inhibition by these lines was
unusual. 184A1 mass cultures exposed to TGFß
at passages (p) 28-35 displayed severe growth inhibition, but a small
subpopulation of cells maintained active growth. Assuming these resistant cells
represented rare mutations, we attempted to obtain pure populations by clonal
isolation. However, like the parental uncloned population, all four clones
isolated displayed a small subpopulation of cells capable of continuous growth
in TGFß. 184B5 exposed to TGFß at p26-40 maintained good growth, but most
clones isolated at p13-16 were strongly growth inhibited. One particular
severely inhibited clone, B5T1, repeatedly underwent an apparent
"crisis" around p30 during which almost all the cells died. The
populations derived from the few surviving cells maintained growth in TGFß. The lack of growth inhibition by TGFß was not due to loss of the ability to respond
to TGFß. All 184A1 and 184B5 cultures
showed morphologic alterations in the presence of TGFß, and all cells tested displayed TGFß receptors and induction by TGFß
of extracellular matrix associated proteins.
In an effort to understand (1) why so many early passage cells from immortal
lines failed to maintain proliferation, and (2) how clonal isolates rapidly
produced cell populations heterogeneous for growth in TGFß, I particularly noted the association of TGFß resistance with an indefinite lifespan in
B5T1. Since the literature at the time was associating telomerase activity with
an indefinite lifespan, I considered the possibility that expression of TGFß resistance and telomerase activity might be
related, and that possibly both phenotypes were not initially expressed in
immortally transformed cells. Perhaps these cell lines were initially only
"conditionally immortal", i.e., permissive for immortality but an
additional step was required for them to obtain a uniform indefinite lifespan.
To test this hypothesis, we proceeded to carefully characterize and ascertain
possible associations among morphology, growth capacity in the absence and
presence of TGFß, telomerase activity,
and telomere length in 184A1 and 184B5 at different passage levels. I summarize
our results below and then provide more details.
Early passage 184A1 and 184B5 cells are only conditionally immortal. The cell
lines, but not each individual cell, have indefinite growth potential. These
early passage conditionally immortal cells express little or no telomerase
activity and show no ability to maintain growth in TGFß. The conditionally immortal cells presumably harbor a
(presently unknown) mutation which permitted their continued growth past
replicative senescence, but this mutation did not result in immediate
expression of telomerase activity. Telomeres continue to shorten with
increasing passage. Cell populations whose mean TRF (terminal restriction
fragment) length had declined to < 3 kb exhibited slow heterogeneous growth
and contained many non-proliferative cells. These cells also accumulated large
quantities of the CKI p57, which we believe may be responsible for the poor
growth (see Section III. B.). Telomerase activity is first
detected when the telomeres become critically short, mean TRF ~2.5-2 kb, and
activity levels gradually increase thereafter. RT-PCR indicates that hTERT mRNA
is not present in the early passage 184A1, but is present in late passage fully
immortal 184A1. Around the passage levels that telomerase activity can first be
detected, there begins a very gradual increase in the number of cells
displaying progressively increased ability to maintain growth in TGFß (see Table 3). By the
time the mean TRF has stabilized at > 3 kb, the cells have converted to full
immortality, characterized by high levels of telomerase activity, uniform good
growth in the absence or presence of TGFß,
and no expression of p57. We have used the term "conversion" to
describe this gradual process. The consistent and reproducible manifestation of
conversion by repeatedly cloned cell populations, and the very gradual nature
of the conversion process, suggest an epigenetic mechanism. We postulate that
there exists an inherent epigenetic mechanism to reactivate telomerase when
telomere length becomes critically short. This program is not normally
encountered in human cells due to the multiple checkpoints imposed by a
stringent replicative senescence mechanism to prevent proliferation of cells
with shortened telomeres. Gradual, epigenetic-based changes in gene expression
might occur in response to development of extremely short telomeres through
alterations in heterochromatin conformation and/or altered transcriptional
activity as a result of redistribution of telomere associated proteins. NOTE:
This whole process of conversion and p57 expression would not be seen in cell
types where adult somatic cells do not have stringent replicative senescence/telomerase
control mechanisms, i.e., all rodent cells. I think this raises serious
questions about the use of rodent "model" systems for studies to
understand human cellular immortalization and early stage carcinogenesis. If a
system doesn't model, it's not a model system.
Now, more details and data. The conversion process is illustrated for MCDB 170
grown 184A1 in Figure 6 and Table 3. Early passage (p11) 184A1 has a mean TRF
of ~5 kb, shows uniform good growth (although no growth in TGFß) with a high colony forming efficiency (CFE).
However, the CFE steadily decreases with passage, with an abrupt decrease in
growth around p16, at ~3 kb mean TRF. In our lab, we refer to this as
"hitting the wall" because of its relative abruptness, and the cells
thereafter look kind of "smashed" (those gross looking flat
vacuolated cells). Between passages 18-30 the CFE remains low, and most
colonies that are still growing contain a mixture of growing and
non-proliferative cells. During this period, the mean TRF declined to ~2
kb with a faint signal. Low telomerase activity was first detectable around
passages 24-30, and increased thereafter. After p30, mean TRF stabilized at
> 3 kb, the CFE increased, and the growth displayed by individual colonies
gradually became uniform. The first detection of sustained growth in TGFß was at ~p28. This growth was exceedingly poor
- but it was maintained. By p30, some cells showed OK growth in TGFß, and after p40, most cells showed good growth
in TGFß.
Figure 6: Comparison of mean TRF length, telomerase activity, and growth ±
TGFß in 184A1 at different passage
levels.
Panel A: TRF length, lighter shaded ovals indicate a faint signal.
Panel B: Telomerase activity, determined semi-quantitatively by comparing the
levels of HMEC telomerase products generated to those generated for a constant
number of 293 cells (1,000 cell equivalents). The following categories were
used to designate semi-quantitative values. Note that the points are presented
in a semi-log form: None = no detectable telomerase products by PhosphorImager
analysis; weak = approximately 5% of telomerase activity of 293 cell control;
low = approximately 10% of 293 control; medium = 25-50% of 293 control; strong
= 75-100% of 293 control.
Panel C: Colony forming efficiency (CFE) and labeling index (LI) in colonies.
TRF length, telomerase activity, CFE and LI were determined as described in
Stampfer et al., 1997.
Table
3: Growth and LI of 184A1 and 184B5 colonies at different
passage levels in the absence or presence of TGFß
LABELING INDEX (%)
|
Cell Type |
Pass # |
TGFß |
<10 |
10-25 |
26-50 |
>50 |
# Colonies |
|
184A1 |
28 |
- |
0 |
12 |
53 |
35 |
47 |
|
|
32 |
- |
12 |
26 |
17 |
55 |
95 |
|
|
38 |
- |
10 |
10 |
12 |
68 |
389 |
|
|
44 |
- |
0 |
2 |
7 |
91 |
272 |
|
|
28 |
+ |
100 |
0 |
0 |
0 |
34 |
|
|
35 |
+ |
59 |
37 |
4 |
0 |
83 |
|
|
44 |
+ |
3 |
11 |
11 |
75 |
85 |
|
184A1-TP |
28 |
- |
0 |
0 |
0 |
100 |
17 |
|
|
28 |
+ |
12 |
11 |
22 |
55 |
42 |
|
B5Y16G |
25 |
- |
6 |
14 |
44 |
34 |
50 |
|
|
31 |
- |
0 |
6 |
0 |
94 |
51 |
|
|
38 |
- |
0 |
0 |
0 |
100 |
91 |
|
|
25 |
+ |
71 |
8 |
13 |
8 |
189 |
|
|
31 |
+ |
20 |
28 |
21 |
31 |
102 |
|
|
38 |
+ |
0 |
0 |
0 |
100 |
135 |
|
B5Y16G-ßR |
26 |
- |
0 |
0 |
0 |
100 |
14 |
|
|
26 |
+ |
0 |
10 |
9 |
81 |
17 |
Legend for Table 3: Single cells were seeded and the LI ± TGFß in colonies containing >50 cells was
determined as described in Stampfer et al., 1997. # colonies refers to the
number of colonies counted to determine percentage LI. 184A1-TP and B5Y16G-ßR represent populations derived from isolated,
early converting cells. 184A1-TP appeared in a slow growing conditionally
immortal 184A1 p23 population, distinguishable by its much more rapid growth.
B5Y16G-ßR was derived from a rare colony
that grew well in TGFß at p24 from the
B5Y16G clone of the B5Y16 clone of 184B5. The data in this table also indicate
that the phenotype of uniform good growth minus TGFß
is acquired prior to that for good growth in the presence of TGFß.
Similar overall results were seen with 184B5. However, unlike very early 184A1,
early passages of 184B5 grow slowly, the mean TRF when first tested was ~3 kb,
and the population already showed some heterogeneity in growth. Some cells
capable of maintaining poor growth in TGFß
were already present. Given this heterogeneity, we studied clonal isolates of
early passage 184B5. Clones isolated at p15 showed a large range of growth
capacity. Some didn't maintain any growth after 2-3 passages, some showed
heterogeneous slow growth, and some had mixed slow and faster growth.
Basically, those that didn't maintain growth also showed no growth in TGFß, no or weak telomerase activity, and short
mean TRFs, < 2.0-2.5 kb, with faint or very faint signals. The clones with
slow growth behaved similar to the above description of 184A1 starting at p20
(slow heterogenous growth but not the "smashed" cells). Repeated
examination of the same clones repeatedly gave the same pattern of conversion.
One clone, B5Y16, was already heterogeneous for growth ± TGFß when first observed at p17. This extremely
rapid generation of heterogeneity in a clonal isolate was further investigated
by isolating subclones of B5Y16 at p20. These also unfolded the whole range of
phenotypes, from no growth, 184A1-like growth, to a few clones that displayed
an already fully immortal converted phenotype. B5Y16 and its subclones demonstrate
that a cell population obtained after less than 10 Pd from one conditionally
immortal cell may be widely heterogeneous. The B5Y16G cells, which are a
subclone of a clone (B5Y16) of a clonal cell line (184B5), are a good
illustration of the inherent heterogeneity in growth response to TGFß and the gradual nature of conversion (see
Figure 7 and Table 3). Although growth was slow and non-uniform when first
observed at p21, by p24 rare colonies with good growth ± TGFß were present. B5Y16G was seeded at clonal
densities at p25 and examined for growth ± TGFß.
Heterogeneity was clearly visible in and among these single cell outgrowths. By
p38, all B5Y16G cells gave rise to good growing colonies ± TGFß. These data with the 184B5 clones and
subclones are inconsistent with a rare mutational origin of the converted
phenotype.
Click here to see figures 7a-e
Figures 7a-e: Heterogeneity of subclone B5Y16G p25 colony growth in TGFß.
1000 cells were seeded into 100 mm dishes and exposed to 5 ng/ml TGFß 15 days after seeding. Cells remained in TGFß an additional 18 days and were labeled with
3H-thymidine for the last 24 hrs. The Giemsa stained, single-cell derived
colonies shown are from the same dish.
(a) colony with no growth in TGFß;
(b) mostly flat colony with rare scattered labeled
cells;
(c) colony with growing small cobblestone cells
amidst flatter cells with little growth;
(d) colony with larger growing areas of small
cobblestone cells amidst flat cells;
(e) rare large colony with uniform good growth in
TGFß.
In both 184A1 and 184B5 we have observed some instances of early conversion to
full immortality. In 184A1 rare early converters rapidly take over the very
slow growing non-converted population (e.g., 184A1-TP). In all cases, the mean
TRF of early converters when initially examined was short (2.0-2.7 kb), and
there was a correlation between ability to grow in TGFß and telomerase activity. These short mean TRFs indicate that
newly converted cells arise from cells with critically short mean TRFs.
III. B. Expression of the CKI p57 during conversion
Index
The presence of a slow growth phase in the conditionally immortal HMEC led us
to examine these expressions of molecules inhibitory to growth. Our first
candidates were CKIs (cyclin dependent kinase inhibitors), particularly, p27KIP1.
Serendipitously, the antibody to p27 cross-reacted with p57 KIP2,
and indicated that changes in p57 expression were associated with conditional
immortality. I summarize the results and then present more data below.
We have examined expression of p57 mRNA (by Northern blots) and protein (by
western blots). Commercially available p57 antibodies are not ideal. We have
frequently seen cross-reacting proteins around the region of the p57 protein
standard in situations were no p57 mRNA expression is seen. These proteins have
slightly different mobilities than the protein bands seen in cells where p57
mRNA is expressed. We have found that p57 mRNA levels are generally indicative
of protein levels. Consequently, we believe mRNA analysis to be a more accurate
method of p57 detection in these HMEC. Based on mRNA and protein analysis we
have found:
1) No p57 detected in our finite lifespan HMEC, including normal MM-grown and
post-selection HMEC, and the EL cultures 184Aa and 185Be.
2) p57 expression in G0 arrested conditionally immortal HMEC which have
wild-type p53. In early passage good growing 184A1, this p57 is downregulated
in early G1.
3) p57 expression in cycling conditionally immortal p53(+) HMEC during the slow
heterogenous growth phase (mean TRF£3kb).
4) Ectopic expression of p57 in good-growing early passage 184A1 recapitulates
the morphology and slow heterogenous growth seen when these cells
"hit-the-wall" around passage 16.
5) A gradual reduction in p57 expression in G0 and cycling populations as the
conditionally immortal cells gradually convert to a fully immortal phenotype.
Furthermore, we have found that the severe growth constraint encountered by
184A1 during passages 16-20 (cf. Figure 6) is
associated with loss of heterozygosity (LOH) for the maternal p57 allele,
followed by transient expression from the paternal allele. In 184B5, where the
slow growth phase does not show such a severe "hit-the-wall" period,
there is no LOH detected.
p57 belongs to the CIP/KIP family of CKIs, which includes p21, p27, and p57.
These CKIs can inhibit multiple G1 kinases through binding CDK-cyclin
complexes. The p57 gene has been localized to chromosome 11p15.5, a region
displaying frequent allelic loss in cancers of the breast, lung, and bladder,
as well as rare pediatric tumors such as Wilms¹ tumor. Loss of heterozygosity
and microsatellite instability at 11p15 have been associated with rapid
proliferation, DNA aneuploidy, and poor prognosis in primary breast tumors. The
p57 gene has been found to be imprinted with preferential expression of the
maternal allele, suggesting that loss of the maternal allele by itself may
severely reduce p57 expression. Germline mutations in the p57 gene have been detected
in some patients with Beckwith-Wiedemann syndrome, a familial cancer-prone
syndrome associated with hyperplastic growth in numerous tissues and a
1,000-fold increase in the risk of childhood tumors. Genetically engineered
mice lacking the p57 gene have a variety of developmental defects consistent
with Beckwith-Wiedemann syndrome, and indicate a role for p57 in control of
cell proliferation and differentiation. p57 mRNA is detectable in most normal
adult tissues, with highest levels in tissues consisting primarily of
post-mitotic cells. In epithelia, p57 is reported to be expressed in regions of
differentiated cells, but not in regions of actively dividing cells, suggesting
that p57 may be up-regulated when cells exit the cell cycle and start their differentiation
programs. p57 is not detectable in most immortal cell lines.
Figure 8 shows p57 protein expression in G0 arrested
(see Section IV for methods of G0 arrest) and randomly cycling
cultures of finite lifespan, conditionally immortal, and fully immortal HMEC.
184A1 conditionally immortal cells accumulate high p57 protein levels in G0 (fig. 8a) compared to the finite lifespan and fully
immortal HMEC. Decreased p57 accumulation in G0 was observed around the passage
levels at which 184A1 converts to the good growing, telomerase(+), TGFß resistant phenotype. In synchronized
populations of early passage good growing conditionally immortal 184A1, the
high level of p57 expression seen in G0 is downregulated between 4 and 12 hours
following release from G0 arrest (fig. 8c).
Thus, randomly cycling early passage good growing conditionally immortal 184A1
(passages 13-15) did not show p57 protein expression. Abundant p57 expression
was first detected at the passage level (p16) corresponding precisely to where
these cells demonstrated the onset of slow heterogeneous growth. p57 levels
remained high in the randomly cycling population coincident with the period if
slow heterogeneous growth (passages 16-38) and mean TRF levels £ 3 kb. Similar results were obtained in
conditionally and fully immortal 184B5 cells, although in this case, the
conditionally immortal cells did not have a mean TRF > 3kb, and always
showed some p57 in the cycling population. p57 expression was not seen in the
finite lifespan or fully immortal cycling HMEC.
These data indicate that the transformation from finite lifespan to conditional
immortality in these HMEC was associated with accumulation of p57 protein
during G0 arrest; however, the good growing conditionally immortal 184A1 (mean
TRF > 3 kb) were able to downregulate p57 upon entry into G1, whereas the
poorly growing conditionally immortal cells failed to downregulate p57 during
G1, and the p57 levels remained high in the cycling populations. Conversion
from poor heterogenous to uniform good growth was associated with loss of all
p57 expression.
These differences in p57 protein levels appear to be determined by changes in
mRNA abundance. Figure 9a shows that the 1.7 kb
p57 transcript was detectable in G0 arrested early passage conditionally
immortal 184A1 but not in normal finite lifespan or fully immortal HMEC
cultures. Analysis of synchronized cell populations following release from G0
arrest (fig. 8b) shows that good growing passage
13 184A1 downregulated p57 transcript levels 4-8 hours after G0 release. In
fully immortal late passage 184A1, the p57 transcript was not detectable during
G0 or at any stage of the cell cycle. Thus changes in mRNA abundance correlated
well with both the accumulation of p57 protein in conditionally immortal HMEC,
and the absence of p57 protein in finite lifespan and fully immortal HMEC.
Of the known CDK inhibitors examined (p15, p16, p21, p27, and p57), only p57
showed this dramatic increase in abundance corresponding precisely to the
slowdown in growth of conditionally immortal cells with critically shortened
telomeres. We have been unsuccessful thus far in experimentally reducing or
blocking p57 expression in order to directly demonstrate the role of p57 in
this growth slowdown. However, we have been able to show that ectopic
expression of the p57 gene into good growing passage 14 184A1 induces premature
onset of slow heterogeneous growth, producing cells with a flattened,
vacuolated appearance similar to uninfected 184A1 at passage 17. The levels of
p57 expressed and LI¹s in the passage 14, p57 virus-infected and passage 17
uninfected cells were also comparable. These experiments provide direct
evidence that, when expressed at levels comparable to those seen in conditionally
immortal HMEC with critically short telomeres, p57 can function as a growth
inhibitor in this cell system.
Exposure of early passage good growing conditionally immortal 184A1 to TGFß leads to complete cessation of growth. When
G0-arrested passage 13 184A1 were exposed to TGFß
upon re-entry into the cell cycle, p57 mRNA was still downregulated after
release from G0. Therefore, p57 mRNA accumulation is not a general consequence
of growth inhibition in these cultures. The impaired ability of fully immortal
HMEC to growth arrest in TGFß is more
likely to be due to changes in regulation of p27, since TGFß did prevent the downregulation of p27 protein
after G0 release in these early passage 184A1, but not in the TGFß-resistant fully immortal 184A1.
We next looked to see if loss of p57 expression in fully immortal 184A1 was
accompanied by genetic changes. PCR analysis of genomic DNA revealed that the
proline-alanine repeat region of the p57 gene was polymorphic in finite
lifespan 184 and early passage 184A1, since amplification of this region
yielded two products of different size (fig. 9.1a&b)
RT-PCR showed the lower band to be the allele primarily expressed in the early
passage conditionally immortal cells. Genomic DNA from the passage 29 and later
cells showed loss of the lower band. To determine whether this loss of
heterozygosity (LOH) represented outgrowth of a pre-existing subpopulation in
the conditionally immortal cells, genomic DNA was harvested from individual
colonies grown from single cells in passage 15, 16, 17, 18 and 25 cultures.
Individual passage 15 clones showed partial loss of the lower band indicating
that allele loss was a frequent event and not due to outgrowth of a rare cell.
The percentage of colonies exhibiting p57 allelic imbalance or complete LOH
increased with increasing passage, indicating that allele loss occurred at
different times in different cells. To reconcile the loss of the major
expressed allele by passage 25 with p57 expression seen at passages 32 and 38,
RT-PCR was performed using total RNA harvested at various passages. RT-PCR
showed that after loss of the lower band, the upper, previously silent allele
was transiently upregulated in conditional immortal 184A1 during the slow
heterogeneous growth phase. After conversion to the fully immortal phenotype,
the remaining allele was downregulated, but not lost. In fact, RT-PCR indicated
that some p57 transcripts persisted in the 184A1 mass culture through p92 even
though no p57 protein or mRNA was detected by immunoblot or Northern analysis
after p38. Unlike 184A1, 184B5 did not undergo p57 LOH although it did show
downregulation of p57 expression during conversion.
The correlation between short mean TRF length and the failure to downregulate
p57 expression upon exit from G0 in conditionally immortal 184A1 suggested that
the shortening of telomeres below a critical length could be responsible. We
were able to test this hypothesis as part of other ongoing studies on the
effect of ectopic expression of hTERT (see Section III. F.)
Transduction of hTERT via retrovirus into good growing passage 12 184A1 (mean
TRF > 3 kb) resulted in a rapid increase of mean TRF lengths to > 9 kb.
In contrast to the control cultures, these cells never underwent the slow
heterogeneous growth phase and p57 mRNA was never detected in the cycling
populations. p57 levels in G0 arrested cells were reduced to undetectable
levels by passage 27. Artificial lengthening of telomeres in the conditionally
immortal HMEC was therefore associated with continued good growth and
abrogation of p57 expression.
Collectively, these results suggest that p57 is expressed by certain cultured
cells when growth constraints associated with replicative senescence have been
compromised; i.e., conditionally immortal cells. The data suggest that p57 may
play an important role in the observed slow heterogeneous growth of this cell
population, inhibiting the conversion of conditionally immortal cells to the
fully immortal state. The absence of p57 expression in almost all human cell
lines is consistent with the downregulation of p57 in the fully immortal HMEC
lines.
III. C. The effects of viral oncogenes on conversion of
184A1
Index
A gradual conversion process had not been previously reported during human
epithelial cell immortalization. Most reported studies of human epithelial cell
transformation in culture have used viral oncogenes and/or inactivation of the
p53 gene to facilitate more consistent and efficient immortalization. The
overall process of immortalization described above for our chemically
transformed immortal HMEC lines did not correlate with the reported
descriptions of immortal transformation following viral oncogene exposure. We
wondered if the potential of these viral oncogenes to simultaneously inactivate
many cellular checkpoints was producing different patterns of immortalization
than would occur in the generation of minimally deviant immortal cell lines
with wild type p53 and RB. We therefore examined the consequences of exposing
early passage (p12) conditionally immortal 184A1 to specific viral oncogenes:
HPV16 -E6, -E7, SV40T, or Ad5 E1A
The brief summary: Exposure to HPV16-E6 resulted in near immediate
conversion to the fully immortal phenotype (good growth ± TGFß, high telomerase activity, stabilized
telomere length). Exposure to HPV16-E7 and SV40T greatly accelerated
acquisition of some conversion phenotypes (uniform good growth, high telomerase
activity, stabilized telomere length) and led to the immediate ability to
maintain some growth in TGFß. Ad5 E1A
caused what appeared to be massive apoptosis, though some cells survived and
rapidly converted. A mutated HPV16 E6 oncogene unable to inactivate p53 was
still capable of near immediate conversion of p14 184A1. We conclude that the
multiple activities of these viral oncogenes (inactivation of p53 and RB, and
many other characterized and as yet uncharacterized additional functions) may
greatly accelerate a step in HMEC immortal transformation - conversion - that
might otherwise be a key rate-limiting step. The ability of these oncogenes to
simultaneously inactivate many cellular checkpoints is likely responsible for
their capacity to achieve reproducible immortalization of HMEC and other human
cells. More details below.
Click
here to see figure 10a
Click here to see figure 10b
Figures 10a & b and Table 4 illustrate the effect of retroviral infection
of p12 184A1 with vectors containing the indicated viral oncogenes, or the LXSN
control vector.
Figures 10a & 10b: Comparison of mean TRF length, telomerose activity,
and growth ± TGFß in 184A1
retrovirally infected with viral oncogenes. Good growing 184A1 p12 were
infected with retroviral vectors containing the HPV16 E6, HPV16 E7, or SV40T
genes, or control LXSN-based retrovirus. Infected cells were obtained following
selection in G418 for 10 days. The infected (184A1-E6, 184A1-E7, 184A1-T) and
control (184A1-LXSN) cultures were then maintained in MCDB 170 medium with
periodic assays for telomerase activity, mean TRF length, and growth ± TGFß as described in Stampfer et al 1997, and the
Figure 6 legend, however the scales for telomerase activity and resistance are
altered compared to Fig. 6.
(10A) data for 184A1-E6
(10B) data for 184A1-E7 and 184A1-T
Table 4: Growth
and LI of retrovirally infected 184A1 colonies at different
passage levels in the absence or presence of TGFß
LABELING INDEX(%)
|
Virus |
Pass # |
TGFß |
<10 |
10-25 |
26-50 |
>50 |
# Colonies |
|
LXSN |
13 |
- |
0 |
0 |
0 |
100 |
203 |
|
|
15 |
- |
0 |
1 |
7 |
92 |
182 |
|
|
17 |
- |
15 |
26 |
26 |
33 |
81 |
|
|
21 |
- |
14 |
22 |
29 |
35 |
59 |
|
|
23 |
- |
1 |
14 |
43 |
42 |
91 |
|
|
28 |
- |
2 |
10 |
48 |
40 |
85 |
|
|
21 |
+ |
100 |
0 |
0 |
0 |
66 |
|
|
23 |
+ |
96 |
4 |
0 |
0 |
78 |
|
|
28 |
+ |
100 |
0 |
0 |
0 |
39 |
|
HPV16-E6 |
13 |
- |
0 |
0 |
0 |
100 |
49 |
|
|
15 |
- |
2 |
0 |
0 |
98 |
63 |
|
|
17 |
- |
0 |
0 |
0 |
100 |
253 |
|
|
13 |
+ |
14 |
11 |
39 |
36 |
28 |
|
|
15 |
+ |
0 |
2 |
11 |
86 |
88 |
|
|
17 |
+ |
0 |
0 |
0 |
100 |
79 |
|
HPV16-E6JH26 |
17 |
- |
0 |
0 |
0 |
100 |
51 |
|
|
17 |
+ |
0 |
0 |
26 |
74 |
53 |
|
HPV16-E7 |
14 |
- |
1 |
0 |
5 |
94 |
96 |
|
|
15 |
- |
0 |
0 |
11 |
89 |
27 |
|
|
17 |
- |
34 |
24 |
42 |
0 |
42 |
|
|
21 |
- |
5 |
7 |
11 |
77 |
122 |
|
|
25 |
- |
0 |
12 |
33 |
55 |
42 |
|
|
29 |
- |
0 |
0 |
0 |
100 |
78 |
|
|
14 |
+ |
26 |
35 |
27 |
12 |
94 |
|
|
15 |
+ |
15 |
51 |
30 |
4 |
168 |
|
|
17 |
+ |
34 |
38 |
28 |
0 |
82 |
|
|
21 |
+ |
22 |
44 |
29 |
5 |
57 |
|
|
25 |
+ |
23 |
33 |
32 |
1 |
85 |
|
|
29 |
+ |
6 |
31 |
42 |
21 |
67 |
|
SV40T |
13 |
- |
0 |
0 |
0 |
100 |
108 |
|
|
14 |
- |
1 |
0 |
2 |
97 |
92 |
|
|
16 |
- |
2 |
0 |
4 |
94 |
48 |
|
|
17 |
- |
18 |
14 |
26 |
42 |
88 |
|
|
21 |
- |
0 |
0 |
0 |
100 |
29 |
|
|
13 |
+ |
12 |
9 |
31 |
48 |
52 |
|
|
16 |
+ |
11 |
7 |
27 |
55 |
44 |
|
|
17 |
+ |
0 |
11 |
27 |
62 |
26 |
|
|
21 |
+ |
1 |
4 |
17 |
78 |
72 |
|
|
27 |
+ |
0 |
0 |
0 |
100 |
132 |
Legend for Table 4: Single cells were seeded and the LI ± TGFß in colonies containing >50 cells was
determined as described in Stampfer et al., 1997. # colonies refers to the
number of colonies counted to determine percentage LI.
The 184A1-E6 culture showed high levels of telomerase activity when first
assayed at p12, and at all passages examined thereafter. Unlike the control
cultures and consistent with its expression of high telomerase activity,
184A1-E6 maintained a mean TRF of ~5 kb with continued passage. 184A1-E6
maintained uniform good growth, with no evidence of slow heterogeneous growth
and was already capable of good growth in TGFß
at p13. At p15, 184A1-E6 showed very low levels of p53 protein, presumably due
to degradation of p53 by the ubiquitin-dependent proteolytic pathway.
We also tested the effects of several different mutated HPV16-E6 genes. Five
mutants (HPV16 E6 Cys-63-Gly, Cys-63-Arg, Cys-63-Ser, Cys-106-Arg, and
Trp-132-Arg; obtained from Vimla Band, Tufts U), with low or no binding to or
degradation of the p53 protein, had no effect on 184A1 conversion, behaving
like the vector alone control. Contrasting results were seen with the amino
terminal HPV16 E6 mutant E6JH26 (obtained from Denise Galloway, U. Wash.),
which has also been reported not to bind or target p53 for degradation and not
to affect p53 transactivation, but which does bind the E6-associated protein
E6-AP and has been shown to activate low levels of telomerase in finite
lifespan human keratinocytes and mammary cells. 184A1-E6JH26 induced a similar
near immediate conversion as wild-type E6, indicating that the E6 oncogene does
not need the ability to inactivate p53 to induce a fully immortal phenotype.
Unlike 184A1-E6, 184A1-E7 showed no telomerase activity at p12. Low levels of
activity were detected at p18 and increased thereafter. By passages 25-29, high
levels of telomerase activity were present. 184A1-T exhibited an even more
accelerated expression of telomerase activity. Very low levels could be
detected at passages 12-15, and high levels were detected by p23. Consistent
with the telomerase activity data, the mean TRF length of both 184A1-E7 and
184A1-T showed an initial decline from ~5 kb at p13 to faint signals of ~3.5 kb
at p21, followed by stabilization of telomere length. Both 184A1-E7 and 184A1-T
experienced some heterogeneous growth between passages 16-20 (see Table 4). 184A1-T populations showed the presence of large
flat vacuolated cells similar to those observed in the 184A1 control
populations during the period of slow heterogeneous growth. Many colonies with
poor or non-sustained growth were visible at these passages. Uniform good
growth was seen by p21 in 184A1-T and by p29 in 184A1-E7. The majority of
184A1-E7 and 184A1-T cells were able to maintain some (although not yet good
uniform) growth in the presence of TGFß
at the earliest passages tested, indicating that this capacity was rapidly
conferred by the expression of the viral oncogene, even before detection of
telomerase activity. This result suggests that these two phenotypes of fully immortal
HMEC can be acquired independently in the presence of specific viral oncogenes.
The HPV16 E7 and E1A oncogenes have been reported to bind and inactivate p27,
which has been associated with TGFß
growth inhibition in our HMEC system and other cell types. This additional
function of the E7 oncogene may account for its ability to rapidly confer TGFß resistance to conditionally immortal 184A1.
Although a similar activity has not been reported for the SV40T oncogene, our
results suggest that it too may be capable of inactivating some aspect of the
TGFß growth inhibition pathway.
Previous reports indicated that HPV16 E6 could induce low levels of telomerase
activity even in finite lifespan human epithelial cells, so we examined our
finite lifespan HMEC to determine whether HPV16-E6 could induce telomerase
activity, and if so, whether it was dependent upon specific parameters of the
HMEC population; i.e., growth conditions, age in culture, or telomere length.
Four different sets of finite lifespan 184 HMEC were examined: (1)
pre-selection cells grown in MCDB 170; this population was infected at p2 when
still proliferative, and assayed at p3 when it contained mostly poorly growing
cells and had a mean TRF of ~8-7 kb; (2) post-selection cells grown in MCDB 170,
infected and assayed at p9 and p18-p20; both these populations had active cell
division, mean TRF ~7 kb at p9 and 5.5 kb at p20; (3) EL 184Aa, the precursor
of the 184A1 line, grown in MCDB 170, infected and assayed at p8 and p13; both
populations had active cell division, mean TRF ~6 kb and 5.2 kb respectively;
(4) 184 HMEC actively growing in the serum containing MM medium, infected at p3
and assayed at p4; mean TRF between 8-8.8 kb when assayed at passages 3-6. As
expected, no telomerase activity was detected in the pre- or post-selection 184
or 184Aa without the E6 oncogene. Introduction of the E6 gene resulted in low
telomerase activity in the post-selection 184 p9 and in the 184Aa p8 and p13
cells. Repeated independent infections showed no telomerase activity in the
near-senescent, but still proliferating, p18-p20 post-selection 184 cells, nor
in the poorly growing pre-selection p3 cells. In contrast to the cells grown in
the serum-free MCDB 170 medium, early passage 184 grown in MM showed a low level
of telomerase activity, even in the absence of the E6 gene. This low telomerase
activity was further increased to a medium level after the introduction of E6.
These data may bear on previous reports indicating that certain populations of
cultured HMEC may have low levels of telomerase activity. It is possible that
the growth conditions, or selection for growth of specific breast epithelial
cell types in culture, can influence whether this activity is present in the
uninfected as well as E6 infected populations. These results show no strict
correlation between the level of telomerase expression induced by E6 and the
age in culture or mean TRF of the cell population. We saw no correlation
between proliferative capacity and the expression of telomerase activity in the
finite lifespan HMEC, as the HMEC population with the most long-term
proliferative capacity, the post-selection cells, consistently shows no
telomerase activity. However, a caution - these results are specific for
specimen 184. Preliminary testing of HMEC from other specimens suggests that
there could be some interindividual variability. We have not had the resources
to check this further.
The rapid induction of telomerase activity in p12 184A1 by HPV16-E6, as well as
its ability to induce telomerase activity in finite lifespan HMEC with mean TRF
values of 8-5 kb, suggest that it acts through a mechanism other than an
epigenetic turn-on of telomerase activity resulting from critically short
telomeres. Telomerase activity is present in both tumor cells and cells with a
high self-renewal capacity. In tumor cells and immortal cell lines, telomerase
activity is associated with telomeres that are generally shorter than those
found in finite lifespan cells However, telomerase positive cells with high self-renewal
capacity do not necessarily exhibit shorter telomeres. Possibly, the mechanism
by which HPV16-E6 reactivates telomerase is more closely related to the
regulation of telomerase activity in normal telomerase positive cells than to
the reactivation of telomerase which occurs during malignant progression.
III. D. Generation of p53-/- HMEC lines 184AA2 and 184 AA3,
and p53(+) 184AA4
Index
Our studies on conversion raised the question of what was the very rare event,
presumably a mutation, responsible for the transformation of finite lifespan EL
cultures into conditionally immortal cell lines. In our system, the data
indicated that it was not changes in p53, RB, p16 or telomerase expression -
the usually identified or postulated culprits. To address this question, we
decided to try the Genetic Suppressor Element (GSE) strategy. GSEs are cDNA
fragments that could potentially interfere with normal gene functions by either
encoding antisense RNA or inhibitory protein fragments. Assuming that
immortality represents a loss-of-function, the hope was that disruption of this
normal function by a GSE would enable us to identify gene products lost during
immortal transformation. A library of small cDNA sequences obtained from normal
184 HMEC was introduced into p12 184Aa (the EL precursor of 184A1) using high
titer amphotrophic retrovirus. Three different new immortally transformed cell
lines designated 184AA2, 184AA3, and 184AA4 resulted. Unfortunately, none of
these lines demonstrated loss of the gene originally responsible for generating
184A1, and so the nature of this step is still unknown. On the up side, we did
generate three new immortal HMEC lines, two of which (184AA2 and 184AA3) are
p53-/-. These data are not in publication yet, but I include some generic
information here since I have been distributing some of these lines already.
184AA2 and 184AA3 provide p53-/- closely related matches to the p53(+) 184A1
and 184AA4 lines, since all are derived from the same 184Aa EL population.
PCR analysis indicated that 184AA3 had a single viral insertion, but the virus
had no cDNA insert. Inverse PCR to isolate the flanking genomic DNA, and
sequence analysis of the recovered clones, showed that the viral insertion was
near the beginning of the first intron of p53. This was confirmed by Southern
analysis of genomic DNA probed with p53 sequences. Southern analysis of 184AA2
also showed that one of the three viral inserts was in the p53 gene. Although
we do not yet know the status of the remaining p53 allele, these lines show
little or no expression of p53 by Western blot analysis. RT-PCR also indicates
that 184AA3 has no band corresponding to a p53 transcript. Thus, these lines
suggest that total loss of p53 - while not necessary - may be sufficient to
immortally transform 184Aa. 184AA4 had no viral inserts and so presumably
represents another spontaneous transformation from 184Aa. Like 184A1, 184B5,
and post-selection 184, 184AA4 expresses a stable p53 protein. 184AA4 also
undergoes a conversion process similar to 184A1.
The p53-/- 184AA2 and 184AA3 lines do not undergo the same conversion process
as 184A1, 184AA4, and 184B5. In 184AA2, high telomerase activity was seen at
the earliest passages tested, with a mean TRF ~4 kb and no further telomere loss.
The only indication that 184AA2 was still undergoing any aspects of conversion
was its initial lack of uniform good growth in TGFß.
In 184AA3, the earliest passages testable (p17) had medium telomerase activity
which increased to high by p23. Initial mean TRF was ~3.5 kb and stabilized
around 4 kb by p23. Early passages did not show good growth ± TGFß, but a relatively rapid gradual increase in
growth capacity led to uniform good growth minus TGFß by ~p23 and plus TGFßby
p30. Neither 184AA2 or 184AA3 had detectable levels of p57 at the earliest
passages tested.
These results suggest that p53 may play an additional role in transformation
and tumor suppression. Absence of p53 may mean that instead of a long very
gradual conversion process with slow growing cells, a more aggressively
proliferative population of fully immortal cells may arise relatively quickly.
We have not yet performed functional studies to determine if the absence of p53
is directly responsible for this greatly accelerated transformation to full
immortality.
NOTE! NOTE! NOTE!: 184A1, 184B5, and 184AA4 are immortally
transformed cell lines. 184AA2, and 184AA3 are immortally transformed
cell lines that are also p53-/-. Normal human somatic cells are never
immortal, do not express high levels of telomerase, have wild type p53 and RB,
and normal karyotypes. Any somatic cell which is immortal, defective in p53 or
RB, or aneuploid is not normal. I consider it grossly incorrect, and a
potential cause of very serious scientific error, to refer to these lines, or
any immortal cell line, as "normal", even if they do retain many
normal properties. The defining characteristics of human cancer cells in vivo
include expression of telomerase, p53 defects, aneuploidy, and defects in the
RB pathway. It's REALLY not OK to refer to cells with these
characteristics as normal, or "normal" (as I sometimes see). They
aren't normal, so calling them normal or "normal" is simply
scientifically incorrect. Would one call a mutated p53 gene "normal"?
Then why call a cell that contains only mutated p53 "normal"? This is
by no means a trivial or picky point. If cells which have already acquired the
defining, and potentially rate-liming steps of early stage cancer (although
still not invasive) are called and thought of as normal, how are we ever going
to understand the processes involved in the early stages of carcinogenic
progression. Or how are we ever going to know what are normal cellular growth
control processes if the cells being studied are already aberrant in their
growth control properties. I believe that the common failure to recognize the
important distinctions between cells that are truly normal and those which are
often misrepresented as normal has allowed a serious flaw to permeate much of
current "mechanistic" molecular biology in the areas of cell cycle
regulation, cancer, and signal transduction.
III. E. Telomerase activity, telomere length, and growth in
fully immortal 184B5
Index
We have done just a few studies looking at fully converted HMEC populations for
growth potential and telomerase activity. Uncloned 184B5 at p99, and five
clones isolated at p96 were examined (Figure 11). The range of mean TRF lengths
for these clones was 2.9 - 7.0 kb. To our surprise, the clone with the shortest
mean TRF, B5Y9H, showed no detectable telomerase activity when first assayed at
p99, although all these clones exhibited good growth ± TGFß at that passage. TGFß did induce morphologic changes in all five subclones. With
continued passage, B5Y9H, but not the other four clones, reproducibly showed a
slowdown in growth around p103, and an initial total loss of proliferation at
p105. However, after a few weeks, some B5Y9H p105 cells began to give rise to
large outgrowths. These cells were subcultured and have maintained good growth
until at least p116. Assay for telomerase activity indicated no or very weak
activity up to and including the non-proliferative p105 population. After the
p105 dishes displayed the large outgrowths, telomerase activity was detectable.
The mean TRF length of B5Y9H hovered around 3.0 kb prior to p105, and increased
slightly thereafter. These data indicate that telomerase activity may cycle off
and on even in converted cells. Unlike conditionally immortal cells,
reactivation of telomerase in B5Y9H occurred relatively rapidly, within one
passage. Additionally, these converted cells differed from the conditionally
immortal in their ability to exhibit TGFß
resistance in the absence of telomerase activity. Their mean TRFs at the point
of telomerase reactivation were also longer (~3 vs. ~2 kb).
Figure 11: Mean TRF length and telomerase activity in late passage 184B5 and
subclones at different passages.
Legend for Figure 11: Assays were performed as described in Stampfer et
al, 1997, and the Figure 6 legend. For TRF length, lighter shaded ovals
indicate a faint signal.
(A) 184B5 and subclones;
(B) B5Y9H cells at different passage levels from two separate freezedowns. The
first telomerase assay at p105 was from dishes containing vacuolated,
non-growing cells. The second assay for telomerase at p105, and TRF values,
were obtained from sister cultures which contained good growing patches.
III. F. Effects of ectopic expression of hTERT in finite
lifespan and conditionally immortal HMEC
Index
We are currently in the process of evaluating the consequences of introducing
hTERT via retroviral vector into non-telomerase expressing HMEC. As these
studies are still in progress, and are just beginning to be written up for
publication, it will be a while yet before they get posted on the web. However,
there is one aspect I would like to point out now, so I will outline what we
have done.
hTERT was introduced into finite lifespan post-selection HMEC from specimens
184 (passages 11 ans 18) and 161 (passage 5). We also expressed hTERT in
conditionally immortal 184A1, not yet expressing telomerase via conversion, at
two different passage levels: passage 12, consisting of good growing cells with
mean TRF > 3 kb, and passage 22, the slow heterogeneously growing population
with extremely short (£2 kb) mean TRF.
The main point I want to make right now is that in all of these conditions the
mean TRF rapidly increased to around 9-12 kb. The finite lifespan cells
transduced with hTERT never encountered the block at replicative senescence,
and therefore never underwent the alterations that permit overcoming
replicative senescence in order to attain immortality. Nor did they undergo the
changes seen in conditionally immortal cells (e.g., p57 expression). The 184A1
transduced at passage 12 (as discussed in section III.B.), never
underwent the slow heterogeneous growth phase nor expressed p57 in the cycling
populations. None of these cells ever attained critically short telomeres - of
the length never found in normal human somatic cells. 184A1 transduced at p22,
in the middle of the slow growth phase, still underwent the gradual process of
attaining good uniform growth as was seen in its retroviral vector alone
control - even with the telomerase expression and long telomeres.
As is discussed in great length below, I am hypothesizing that telomerase can
be reactivated in immortally transformed cells as a consequence
of the errors which permit overcoming replicative senescence. Continued growth
with critically short telomeres will lead to an epigenetic reactivation of
telomerase. Most human tumor tissues have telomere lengths shorter than normal
tissues, and most tumor derived cell lines have short regulated telomere
lengths. It is quite possible that this is because the tumor cells have
attained immortality and reactivated telomerase as a consequence of
overcoming replicative senescence. Ectopic expression of hTERT does not mimic
this process. The subsequent immortal cells have attained their immortality by
a different pathway - direct expression of hTERT under no regulatory control, bypassing
senescence - and do not have the same phenotype or history as cells which have
had to overcome replicative senescence and undergo conversion. These
differences could be significant for understanding how tumor progression occurs
in vivo, and how one might design therapeutic intervention. I therefore have
serious reservations that immortalizing cells via hTERT will provide an
accurate model system to mimic the progressive stages of human carcinogenesis.
III. G. Speculations about the conversion process
Index
My style in developing this HMEC model system has been to look at large scale
pictures, in low resolution, and to assist others in further investigation of
interesting sub-fields at higher resolution. So my speculations about
conversion, and what it all means, are more encompassing than precise. The
questions that I find interesting are:
(1) What are the underlying mechanisms?
(2) Does a conversion like process occur during in vivo carcinogenesis?
(3) Can these studies lead to something clinically useful?
(4) What can this tell us about scientific approaches?
III. G. 1. Speculations about mechanisms
Index
Section under reconstruction
III. G. 2. Speculations about conversion in vivo
Index
I consider one of the most interesting question to be whether a conversion
process occurs during carcinogenic progression in vivo. We currently have no
data relevant to this, so this is just speculation. I have found one report
about the existence of continued telomere shortening for around 30 passages
post-establishment prior to stabilization of telomere length in two immortally
transformed cell lines from breast cancer pleural effusions, and I have heard
from other investigators that establishment of some human tumor cells lines in
culture commonly involves a long period of poor growth.
What excites me is that the gradual process of conversion appears to more
closely model the development of human tumors, than the more rapid
transformation to immortality seen in viral oncogene mediated immortal
transformation. Many primary carcinomas (particularly ones that are largely p53(+),
like breast carcinomas) exhibit an extended period of slow, heterogeneous
growth prior to the appearance of more aggressive, invasive tumors. It's
possible that a gradual conversion process in vivo could, at least partially,
account for this slow, heterogeneous growth. An extended period of conversion
would provide a continuous pool of slowly dividing cells able to accumulate
errors which both promote malignant behavior (e.g., growth factor independence,
vascularization, genomic instability) and provide a selective advantage.
Conversion to full immortality might not even be necessary for a tumor to
become malignant and metastatic. The extended period of conditional immortality
could be sufficient. Our data indicate that conditionally immortal cells can
undergo a very large number of population doublings before becoming fully
converted. We have also seen that there can be stochastic emergence of rare,
more aggressively growing fully converted cells. Acquisition of genomic
instability (which we have shown is not obligately associated with immortal
transformation) would facilitate the malignant transformation of conditionally
immortal cells.
Our data with the p53-/- lines raise the intriguing possibility that the poorer
prognosis seen in breast tumors with mutated p53 could as least in part be
related to an accelerated conversion process and absence of p57 expression. How
can any of this be translated into improvements in detection, prevention,
prognostic information, or treatment of breast cancer? I don't know, and I'm
not even ready to speculate on the web site. I do believe that uncovering a
novel process in human epithelial cell transformation may well open the door to
novel methods for clinical intervention. And, I am concerned that potential
therapeutic targets will be overlooked if this novel process is ignored, and
researchers use only models in which conversion doesn't exist, or is difficult
to detect (e.g., viral oncogene immortalization, all rodent immortalization,
immortalization with hTERT, and to some extent, immortalization through loss of
p53). I therefore welcome input and collaboration with others on this most
important topic.
III. G. 3. Speculations and opinions on how all this
relates to approaches to scientific questions
Index
CAUTION: The following presents my strong editorial opinions.
Pick up any good molecular and cell biology journal and look at the abstracts.
Many make very generic conclusions about how "cells" work, e.g., cell
cycle and signal transduction mechanisms, without ever identifying in the
abstract what "cells" are being studied. Some never identify the
"cells" in the introduction. For some papers, you have to look
carefully in the Methods section to find out what cells were used. My random
sampling notes that in a large percentage of these cases the "cells"
being referred to are some variant of 3T3 or HeLa. Does most of the scientific
community really believe that all cells are equivalent, that an immortally
transformed p53-/-, aneuploid rodent fibroblast cell (3T3) or an immortally
transformed functionally p53-/-. RB-/-, HPV positive, aneuploid cervical
carcinoma derived cell (HeLa) will accurately reflect the cell cycle, signal
transduction, etc., mechanisms of normal finite lifespan human cells? Or any
normal cell? Sweeping generalizations are being presented as "truths"
based on studies of cells grossly deranged in many known (and unknown)
processes of growth control. Cancer cells are defined by having deranged growth
control. We even have distinguished journals publishing papers that say that an
immortally transformed functionally p53-/- and RB-/-, SV40T positive, aneuploid
human mammary cell line, which upon continued passage can demonstrate AIG and
even tumorigenicity (HBL100) are "normal diploid" cells, and can be
used as "normal" controls for tumor cells. This is incontrovertibly
serious scientific error. And I observe almost no notice or concern about this
in the scientific community.
One cell type obviously does not accurately represent the behavior all of cell
types. We are humans and not yeast; our bodies function based on very complex
interactions of many different differentiated cell types - which have different
histories, functions, gene expression, and fates. Our research and that of
others shows significant differences in key cell cycle regulators and
senescence mechanisms between normal epithelial and fibroblast cells, even from
the same person's breast (e.g., p21, p16, p53, responses to TGFß, PDGF, cAMP, HPV16). Our research shows
obligate differences in cell cycle regulation between finite lifespan and
immortal cells (e.g., expression and regulation of some CKIs and c-myc,
response to TGFß). Our research and
others show significant differences in telomerase regulation between human and
rodent cells.
Generalizations from one cell type to another can also be misleading at a
subtler level than the presence or absence of specific molecular derangements.
Many areas of science and biology are coming to appreciate that whole systems
function not so much by simple linear pathways as by complex interacting
networks, e.g., see Pfeifer, Nature 400:213'99; "despite our desire for
cells to think in linear terms, they refuse to do so... (we) will have to
adjust to the new millennium, in which intricate networks integrate many inputs
to generate the complex output that is cell behavior."
So even if two different cell types contain a similar complement of "nodal
points" (molecules), the actual pathways utilized by those two cells could
be quite different, and of significance to how imputs are normally integrated
in each particular cell to yeild outputs. The actual way a cell wiring system
is utilized under physiological circumstances is also unlikely to be mimicked
by examining the effects of non-physiological forced overexpression of one or
multiple genes under no normal cellular control.
Yet in practice, many biologists act as if finite lifespan and immortal, p53+
and p53-, epithelial and fibroblast, rodent and human cells, etc., are all
functionally equivalent. The behavior of molecules ectopically overexpressed is
used to "define" mechanisms, with the implicit assumption that what
is being observed is the same as actual physiology. How have we come to such an
illogical, patently incorrect situation, and what can be done about it?
Let's say you're a good molecular biologist studying growth factor molecules,
epidermal growth factor in particular. Would you write papers that didn't
distinguish, that treated as functionally equivalent, EGF and TGF-a,
amphiregulin, or VGF? EGF and the FGF or PDGF family, CSF, NGF? human EGF and
the Drosophila EGF-like homologue spitz?, wild type EGF and an EGF molecule
with significant amino acid substitutions? prepro-EGF and active EGF? So, as a
cell biologist studying human carcinogenesis, I'm baffled as to why good
molecular biologists write papers and give talks that don't distinguish, that
treat as functionally equivalent: mammary, liver, colon, and keratinocyte
cells; epithelial, fibroblast, macrophage, and neuronal cells; cells with wild
type vs. mutant p53; human, mouse, rat, and chicken cells; finite lifespan,
immortal, viral oncogene transformed, and tumor derived cells. The most logical
explanation I've come up with is that the exigencies of funding have led many
investigators to keep doing the next step in the same systems they've been
working with, since most funding agencies are not known to fund actual
proposals, and it could be scientific career suicide to do work that required
more long-term system development.
In my opinion, one thing that could be done about this situation is to have
journals require all papers to clearly identify the source of the cells being
used, and all information potentially relevant for the conclusions drawn, e.g.,
finite lifespan or immortal, cell type and species, status of p53 and RB,
tumorigenic properties, presence of viral oncogenes, etc. These are very
significant variables, and need to be identified just as one would identifiy
other variables which may significantly influence the results. Generic
conclusions about "how cells work" based on studies with one or a
limited number of cell types should be disallowed.
This current, to me highly illogical situation of acting as if all mammalian
cell types are functionally equivalent, has led me to consider how our
approaches to scientific questions influence the kinds of data we obtain, how
we interpret that data, and how we value different kinds of data.
My point of view is well reflected in a quote from Dan Mazia in the ASCB newsletter:
"There are many paths in the advancement of science, but the giant leaps
in our Science of the Cell have been made by seeing. First we see and then we
interpret and only then do we pursue mechanisms and theories. The gift of the
great microscopist is the ability to think with the eyes and see with the
brain".
I too believe that careful seeing is the important first step for novel
scientific exploration. Thus, I see that science advances by first carefully
observing nature, then discerning the patterns behind the observed phenomena,
describing and measuring these patterns, and finally looking for the mechanisms
which give rise to the observed patterns. The image that conveys for me this
logical order is also the microscope. If one wishes to observe a structure at
high resolution, one doesn't first use the highest power objective available.
First the lower resolution picture is brought into focus, and then higher
resolution images are gained via a stepwise approach. In this manner one has a
sense of the larger context in which the observed detailed structure lies. In
contrast, focusing on the detail of an area at high resolution, before
ascertaining the location and function of that area within the larger context,
may elucidate patterns of great beauty and elegance. These lovely patterns,
however, may not provide much predictive power about the behavior and
organization of the larger scale structure of interest.
So, what I see, is that many molecular biologists seem to believe that the most
important thing is to explain "mechanisms" at the highest available
resolution. Looking at larger scale pictures at lower resolution is commonly
dismissed as "phenomenology", unworthy of serious attention or
funding. In the absence of stepping back to grasp the more encompassing
picture, more and more detailed studies are being done using the same cell
culture technology previously employed. This cell culture technology may have
been the state-of-the-art 10, 20, 30 years ago, but is now very dated. Much
better options are currently available, and even better options could be
developed if resources were expended in that direction. In contrast, most
molecular biologists would consider it silly to even think of using 10, 20, 30
year old molecular techniques, when much better options are available. And they
would consider expending resources to improve molecular technologies resaonable
and valuable. I think this attitude is detrimental to the advancement of
science. I believe it has led to some very elegant studies being done in cell
systems that are basically uninterpretable if the question of interest is
understanding normal human cellular physiology, and the derangements which
transform normal human cells into malignant. How can one possibly know if
results seen in deranged cells reflect normal human unless the studies have
already been done on normal human cells. I see no good reason for most of the
continued use of cell technology like 3T3 and HeLa for studies on topics like
cell cycle regulation and signal transduction. Much better options are
available, although they may take a little more effort to start.
Yes, it is somewhat more difficult to use normal human cells, and there is no
easy way to do in vitro - in vivo correlations, or things like knockout
experiments. Sometimes experiments need so many cells with sufficient PD that
immortal lines will be required. There will still be a need for model systems
that model. Nonetheless, I believe that if there were the collective agreement,
bolstered by funding support, to put more resources into development of cell
culture systems that can optimize modeling of vivo reality (including ones that
allow study of cell-cell and cell-matrix interactions) this could be
accomplished in a reasonable time frame. I truly believe that most scientists
are motivated to discover the true laws of nature and to better the human
condition. While there is no way to know for sure the eventual significance of
one's research on human health and well-being, I think we can greatly improve
our odds by avoiding obvious anachronisms like using HeLa to study cell cycle
control. If you must use immortal cells, minimally deviant lines like 184A1,
184B5, and MCF10A are available.
One more personal point of view. In biological systems, complexity and productivity
are enhanced by diversity. So too, I believe the scientific endeavor is
enriched by including those with a diversity of scientific approaches, and
impoverished if we are all required to conform to a majority mold which does
not fit. Since some of my style and skills differ from what I perceive as the
accepted and valued current norm, I am sensitive to how minority viewpoints and
skills get excluded. I survived many years of being told that what I was doing
(trying to develop improved human cell culture technology to better address
questions of human cell physiology and carcinogenesis) was just phenomenology,
"gardening", even "witchcraft". Valid, although minority
approaches can illuminate things that others miss, can create resources that
others can't. While I think it appropriate for most scientists to follow the
"high resolution - small field" approach, I believe we all benefit if
our scientific culture (including funding and publishing organs) has the
tolerance limits both to openly support some who follow the "low
resolution - large field" approach and to direct "high resolution -
small field" studies to areas that appear most promising based upon the
"larger field" work.
IV. Synchronization of HMEC Cultures and Role of EGF Receptor
Signal Transduction
(references: Stampfer, Pan et al. 1993; Stampfer and Yaswen, 1993; Bates et
al., 1990)
Index
One of the my long-term goals in developing the HMEC system was to ask
questions related to mechanisms of growth control, such as those controlling
expression of finite lifespan, senescence, escape from senescence
(immortality), and the role of specific positive and negative growth factors in
normal and transformed cells. I assumed that these processes would be connected
to cell cycle control, and that in order to examine the cell cycle, it would be
necessary to obtain synchronized cell populations. Therefore, I looked for a
method to synchronize the HMEC. Additionally, I wanted to find a method that
would not involve use of metabolic inhibitors or general starvation, and thus
potentially not be cytotoxic or stress inducing.
We had previously shown a stringent requirement for EGF receptor (EGFR) ligands
(e.g., EGF/TGFa) for clonal growth of the HMEC, although the normal HMEC could
grow in mass culture without addition of exogenous EGF. Further study
demonstrated that the mass culture growth was due to an autocrine loop
resulting from endogenous production of EGF-like ligands such as TGFa and
amphiregulin. Blockage of EGFR signal transduction with an antibody to the EGFR
prevented growth. Although 184A1 and 184B5 synthesized similar amounts of TGFa
as normal 184 HMEC, they failed to secrete this protein, and thus required
addition of EGF to the medium for growth (see figure 13).
The above data suggested that blockage of EGFR signal transduction might
provide a method to reversibly arrest these HMEC, and this possibility was
examined in detail. After growth with EGF to midconfluence, HMEC cultures were
maintained for 48 hrs in medium without EGF and containing monoclonal antibody
(MAb) 225 to the EGFR. Cells were then refed with medium containing 5 times
normal EGF. During exposure to MAb 225, the HMEC acquired a less refractile
morphology with increased cell-cell contact, decreased motility, and few
mitoses. After re-exposure to EGF, the typical cobblestone epithelial
morphology and many mitoses were visible by 24 hrs. Normal HMEC could be
maintained for at least 18 days in EGF deficient medium plus MAb 225 and still
regain a normal cobblestone appearance with many mitoses after EGF re-exposure,
suggesting that the growth inhibited cells were arrested in a viable,
non-cytotoxic state (I refer this state as sleeping/hibernating). We have not
systematically tested 184A1 and 184B5 for long-term viability in minus EGF
medium. Although they enter quiescence after 48 hrs without EGF, differences in
the G0 state between finite lifespan and fully immortal HMEC may mean that the
immortal cells differ from the normal HMEC in their ability to remain viable in
"hibernation".
Protein and DNA synthesis in normal 184 and 184B5 were assayed by incorporation
of 14C-leucine and 3H-thymidine (Figures 12a & 12b).
Protein synthesis remained depressed as long as the antibody was present and
increased rapidly following re-exposure to EGF. DNA synthesis decreased 12 hr
after antibody addition, and was sharply decreased by 24 hr. DNA synthesis
resumed only 10 hr after EGF re-exposure and then increased sharply to a peak
around 18 hr. We have examined cells from reduction mammoplasty specimens 48
and 161, and found similar results. For specimen 48, DNA synthesis following
restimulation with EGF began and peaked about two hours earlier, and there was
greater synchrony exiting S phase, suggesting that good synchrony could be
maintained into the next cell cycle.
Click here to see figures 12a & 12b
Figure 12. Effects of blockage of EGF retor signal transduction on DNA and
protein synthesis by normal 184 HMEC and 184B5.
(A) Cells from specimen 184 were grown in 35mm dishes in complete MCDB 170
until midconfluence. Treated cultures were then exposed to MCDB 170 minus EGF
plus 8 ug/ml MAb 225 for 49 hrs, while control cultures received complete MCDB
170. After 49 hrs, all dishes were washed once with PBS and refed. Treated
cultures were refed with either complete MCDB 170 containing 25 ng/ml EGF (u) or maintained in MCDB 170 minus EGF
plus 8 ug/ml MAb225 (n).
Control cultures (l) were
refed with complete MCDB 170 containing 25 ng/ml EGF. Cells were exposed to a 2
hr pulse of 5 uCi 3H-thymidine (closed symbols) and 80 nCi 14C-leucine (open
symbols) in 1.5 ml of medium for 1 hr before and after the indicated times.
Total acid-insoluble counts were then determined and are presented on a per
dish basis. (B) Cell from 184B5 were treated as for 184 with two differences:
no MAb 225 was used and the cells were kept -EGF for 48 hrs.
Figure 13. TGFa production and secretion, and effects of EGF on growth and
DNA synthesis of normal, immortally transformed, and EGF independent variant
HMEC.
To determine the effect of EGF on growth rates, 0.5 x 10⁻⁵ cells were seeded
into 35mm dishes in either complete MCDB 170, MCDB 170 minus EGF, or MCDB 170
minus EGF containing 6µg/ml of MAb 225. The number of attached cells was
determined 16-24 hr later. When control cultures (complete MCDB 170) were just
confluent, all cell cultures were trypsinized and cell numbers determined by
Coulter Counter. To determine the effect of EGF on DNA synthesis, midconfluent
cultures that had been grown in complete medium were switched to the indicated
medium for 24 hr. For the last 2 hr, cells were exposed to 4 µCi 3H-thymidine
in 1.5 ml. Acid precipitable counts were determined by scintillation counting.
To determine TGFa synthesis and secretion, cells were grown in 60mm dishes
until subconfluence. 24 hr conditioned medium was then removed, and the cells
harvested and frozen. Radioimmunoassays of medium and cells were performed by
Robert Coffey, Vanderbilt University. These data indicate that 184A1 and 184B5
synthesized amounts of TGFa similar to normal 184 HMEC, but failed to secrete
this protein. The ability of the variant lines to maintain growth in the
absence of EGF did not appear to be due to increased TGFa secretion. Although
A1NE and B5NE could continue to grow in the absence of EGF, their rate of
growth was decreased, and they were still sensitive to MAb 225 induced
inhibition of growth and DNA synthesis. It is possible that increased synthesis
of another ligand for the EGF receptor, such as amphiregulin, may be
responsible for their altered growth properties. The ENU induced variant,
A1ZNEB also grew faster in the presence of EGF, but it was no longer sensitive
to MAb 225 inhibition. Additionally, it showed significantly increased levels
of cell-associated TGFa protein. One possible explanation for this phenotype is
internal or membrane associated stimulation of the EGF receptor. The ENU
induced variant B5ZNEI showed no difference in growth rate with or without EGF,
but was still partially sensitive to MAb 225 inhibition.
Specimen 184 was tested for how long a period of EGF re-exposure was needed
following arrest to allow cells to subsequently enter S phase, with the result
that a 1 hr exposure was sufficient to allow the majority of cells capable of
cycling to later enter S. Thus EGF seems necessary just to get the cells into
cycle (a competence rather than a progression factor). All the other growth
factors were present in the medium, so we can not say if any of them
specifically function as progression factors.
The above results suggested that HMEC restimulated with EGF following the
growth arrest were exiting a Go state and entering S phase in a highly
synchronous fashion. Examination of early response gene expression supported
this conclusion. Expression of c-myc, c-jun and c-fos was readily detectable in
normal cycling HMEC cells, but decreased during growth arrest. High levels of
mRNA for all these genes were observed at 1 hr following re-exposure to EGF.
184B5 differed from normal HMEC in not showing any decrease in expression of the
early response genes during the Go arrest, while 184A1 at p31 showed a partial
decrease. We now know that this difference correlates with conversion to full
immortality. Late passage 184A1 as well as late passage 184B5 do not
downregulate c-myc mRNA or protein during the Go state. Synthesis of TGFa mRNA,
which was also inhibited in the presence of MAb 225, was detected by 2 hr after
EGF re-exposure. Some mRNA species, such as for keratin 5 and CLP, continued to
be expressed during the growth arrest.
Studies done largely with growth arrested fibroblast cells have defined a Go
state characterized by low metabolic activity, a rapid increase in levels of
mRNAs for certain early response genes upon release from the growth arrest, and
an increase of 6-7 hr in the time required to begin DNA synthesis following
release from growth arrest, relative to continuously cycling cells. These
properties are all observed with the HMEC growth arrested by EGFR blockage,
suggesting that this is a Go arrest. Thus, blockage of EGFR signal transduction
is sufficient by itself to cause normal and immortally transformed HMEC to
enter a Go-like resting state. Unlike fibroblast cells from the same specimens,
the levels of c-myc mRNA in HMEC remained high throughout the cell cycle, while
c-fos and c-jun mRNA, though showing cycle dependent fluctuation, were readily
detectable in the cycling epithelial cell populations.
Exit from a Go state is not the same as passage from M into G1. In experiments
with 184B5, we examined the mRNA synthesis into the second cycle, and could see
an absence of the strong burst of early response gene expression as cells
entered G1 without a Go exit. Levels of these mRNA species did increase, and it
could be seen that the rise in c-fos expression preceded that for c-myc and
c-jun. To study the cycle without a Go arrest, one can follow the cells into
the second cycle, or use a method for G1 arrest developed by Keysomarsi et al.,
1990, which utilizes Lovastatin, an inhibitor of
3-hydroxy-3-methylglutaryl-coenzyme A reductase.
V. TGFß Effects
on Normal and Transformed HMEC
(references: Hosobuchi & Stampfer, 1989; Stampfer, Yaswen et al. 1993;
Slingerland et al. 1994; Sandhu et al. 1997; Stampfer et al. 1997)
Index
TGFß is a pleotropic cytokine known
to be a potent growth inhibitor of normal epithelial cells in vitro and in
vivo. It modulates several key physiologic processes such as wound healing,
differentiation, and tissue morphogenesis and remodeling, and is also thought
to be involved in carcinogenic progression. Varying degrees of resistance to
TGFß induced growth inhibition are seen
in human carcinoma cells, and this loss of negative growth regulation may
contribute to tumor development. While in some instances, resistance correlates
with loss of functional type I and II TGFß
receptors, most resistant tumor lines express normal numbers of apparently
functional receptors.
I initially examined the effects of TGFß
on HMEC to determine if it could be a good method for cell synchronization.
This was clearly not the case. However, in the course of these studies I found
that growth responses to TGFß were one of
the clearest differences between the finite lifespan and immortal cells, and
got hooked on trying to understand why (see Section III.).
My first difficulty with TGFß was simply
getting consistent results on the extent and speed of growth inhibition of
normal HMEC from the same individual. This mystery was partially solved when I
controlled for passage level and selection batch. The effect of TGFß on some individual specimens depended upon
age in vitro. While every finite lifespan HMEC that we have tested is
ultimately growth inhibited by TGFß,
younger cells in culture may undergo 8 or more PD before full arrest, whereas
older cells stop growth in 1-2 PD, and with lower TGFß concentrations (see figure 14). The
normal HMEC show distinctive morphologic changes in the presence of TGFß, characterized by an elongated, flattened
appearance. The growth inhibition was only partially reversible, the extent of
reversibility decreasing with age in vitro, and was relatively asynchronous
(see figure15A). The cells were not in a resting
state, since 14C-leucine incorporation indicated that protein synthesis was
stimulated even as growth was inhibited (see figure15A).
The growth arrest is in mid to late G1; TGFß
added at £ 10 hrs following Go exit was
not growth inhibitory.
Figure 12. Effect of TGFß on
growth of normal and transformed HMEC.
Cultures were seeded into triplicate 35 mm dishes (4-5 x 10⁻⁴ cells/dish) in
the indicated concentration of human recombinant TGFß 1. The number of attached cells was determined 4-16 hr later.
When control cultures were subconfluent or just confluent, all cell cultures
were trypsinized and cell numbers determined by Coulter Counter. The attached
cell number was subtracted from the final cell count. Data are presented as
percentage cell number of the TGFß
exposed cells relative to the non-TGFß
treated controls. The ß-resistant 184B5
were assayed at p26; the B5T1 p16 represent a very b-sensitive clone, isolated
at p15, which ceased almost all growth by p30. The ß-resistant
B5T1 p35 represent populations derived from the few surviving cells. 184A1 was
assayed at p39; the A1L5-S represent one of four clones isolated from 184A1 at
p29-34, and was assayed at p32. All 4 clones gave results similar to the
uncloned population when assayed within 11 passages from isolation. NOTE:
When I refer to the finite lifespan cells as TGFß
sensitive, this means that no cell (as in zero) has been capable of maintaining
growth in the presence of TGFß. This is very
different from what may be called 'TGFß
sensitive" breast tumor cell lines, where what it referred to is often a
reduction in cell number or growth rate. When I refer to immortally transformed
cells as TGFß resistant, this means that
the cells can maintain growth indefinitely in the presence of TGFß. However, there may still be some reduction
in growth rate or cells which don't maintain growth.
Another mystery which I never solved (or published, since I didn't know what to
make of it) was stumbling across the observation that addition of MAb 225 to
normal HMEC growth arrested by TGFß led
to synchronous entry into S phase, within 3 hrs, of the cell population that
was reversibly inhibited (see figures 13 A&B). This seemed to imply that
some function of the EGFR was required to maintain TGFß growth arrest in late G1.
Click here to see figures 15a & 15b
Figure 15. Effect of addition of MAb 225 on cells arrested in late G1 by TGFß.
(A) 184 p12 were seeded in triplicate 35mm dishes in MCDB 170 until
midconfluence. Treated cultures (n)
were then exposed to 5ng/ml TGFß for 48
hr. All dishes were then washed once with PBS+0.1% BSA. The TGFfl treated
cultures were refed with either complete MCDB 170+BSA with no TGFfl (s), MCDB 170+BSA with 6
µg/ml MAb225 (u), or maintained in
MCDB 170+BSA+5ng/ml TGFfl (n).
Control cultures (l) were refed with
complete MCDB 170+BSA. Cell labeling was as described in figures
12a & 12b. Results are presented on a per dish basis. Cells exposed to
continuous TGFfl had about 1/2 the cell number as control cultures after 48 hr,
and about 1/3 after 72 hr.
(B) 184 p13 were seeded into triplicate 35 mm dishes and grown in MCDB 170
until sparse- midconfluent. Treated cultures were then exposed to 20 ng/ml TGFß for 48 hr. All dishes were then washed 1X and
refed as indicated. For 1 hr before and after the indicated times, cells were
exposed to 5 µc 3H-thymidine in 1.5 ml. Total acid-insoluble counts were
determined and presented on a per dish basis. Cells exposed to continuous TGFß had 1/3 the cell number as control dishes
after 72 hr of TGFß exposure. TAb 1 is an
antibody to TGFa. It's effect was generally similar to that of MAb 225,
indicating that the observed result with MAb 225 is not due to an agonist
effect; however, since EGFR ligands in addition to TGFa may be present, TAb 1
did not have as stringent an effect as MAb 225.
Examination of 184A1 and 184B5 for their responses to TGFß is what really caught my attention. Whereas I
had never seen a single finite lifespan HMEC maintain growth in TGFß, the immortally transformed HMEC lines could
give rise to populations that maintained growth indefinitely in the presence of
TGFß. The data illustrating these
initially puzzling results that led to the studies described in Section
III. A. is shown in figure 14.
Although growth responses to TGFß varied
among the normal and immortalized HMEC, all of these HMEC showed a similar
profile of TGFß 1 receptors and all
expressed specialized responses to TGFß
including strong induction of: mRNA and/or protein for extracellular matrix
associated proteins such as fibronectin, collagen IV, and laminin; the
proteases, type IV collagenase and urokinase type plasminogen activator; the
protease inhibitor, plasminogen activator inhibitor 1. The level of overall
protein synthesis, especially secreted proteins, was increased following TGFß exposure even where cell growth was
inhibited. These results indicated that the effects of TGFß on HMEC proliferation could be dissociated
from its effects on specialized responses likely to play a role in glandular
remodeling, homeostasis and/or wound healing. It should be noted that
fibroblast cells can show similar specialized responses to TGFß in the absence of growth inhibition.
Fibroblasts from specimen 184 show a slight growth stimulation in TGFß.
We next examined the effects of TGFß on
cell cycle related genes and proteins. Finite lifespan and immortal 184A1 and
184B5 HMEC populations were analyzed after exit from G0 following release from
EGFR blockage. The following summarizes some of our results (some of
which we have never gotten around to publishing).
1) RB is normally phosphorylated in these HMEC 5-10 hr after G0 release.
Exposure to TGFß prevented this
phosphorylation in the TGFß growth
inhibited finite lifespan and conditionally immortal cells, but not in the TGFß resistant fully immortal cells.
2) In finite lifespan and conditionally immortal HMEC, levels of c-myc, c-fos,
and c-jun mRNA, and c-myc protein (c-fos and c-jun proteins were not examined)
are low during G0 arrest. In contrast, fully immortal 184A1 and 184B5 did not show
downregulated expression of these molecules during G0. TGFß had no effect in any of the HMEC (growth
inhibited or not) on the normally high level expression of these molecules seen
l hr after G0 release. In the presence of TGFß,
normal 184 and all 184B5 HMEC examined (conditional and fully immortal) showed
decreased myc levels £5 hr after G0
release, while levels in all 184A1 examined were not significantly affected.
Thus, contrary to reports in other systems, we did not see any TGFß effects on myc expression that correlated
with extent of growth inhibition. This difference may be due to our use of
cells that are all responsive to TGFß, in
contrast to studies where the cells were not only resistant to TGFß growth inhibition, but also non-responsive.
Because TGFß can affect more than one
cellular pathway, these results caution against assuming that any differences
observed between responsive and non-responsive cells are necessarily
contributing to the growth inhibition pathway.
3) In general, cyclins D1, D2, E, A, and B are expressed during the cell cycle
with kinetics similar to reports in other cell types. Exposure to TGFß reduces expression of cyclin A mRNA and
protein in the growth inhibited cells, and has little if any effect on D1, D2,
E, or cdk2 bound E, with the exception of reduction in cyclin E mRNA cdk2 and
cdk4 protein levels are constant throughout G0 and the cell cycle, and are
unaffected by TGFß in any of the HMEC.
The above studies had not detected major TGFß
induced effects on expression of cell cycle associated molecules to account for
the failure to phosphorylate RB in the growth inhibited populations. In
collaboration with Joyce Slingerland, U.Toronto, this led us to examine the
activities responsible for RB phosphorylation, namely the cyclin/cdk complexes
D/cdk2,4,6, E/cdk2, and A/cdk2, and further, the molecules capable of
inhibiting this activity - the CKI.
Cyclin D1-cdk4 (or D1-cdk6) complex formation is normally detected 6-18 hr
following G0 release. In the presence of TGFß,
the growth inhibited cells failed to show this complex formation, or
D-associated kinase activity, whereas these complexes were unaffected by TGFß in the resistant cells. Assays for cyclin E
and A associated kinase activity also showed significant inhibition in the TGFß sensitive cells upon exposure to TGFß. This decreased activity was due to the
presence the CKI p27. p27 inhibitory activity is normally highest in G0, and
then decreases as the cells progress through G1. In TGFß exposed normal HMEC, this activity remains elevated throughout
G1. We also observed that the fully immortal cells had significantly less CKI
activity in G0, independent of TGFß
exposure.
Further studies examined the role of the CKI p15. In all examined HMEC, p15
mRNA is expressed in G0 and decreases as cells progress into G1. Consistent
with the report that TGFß increased p15
mRNA levels, we observed that TGFß caused
p15 mRNA expression to remain at the G0 level even after exit into G1. However
(like the studies above with c-myc), this was true for both the growth
inhibited and resistant cells, indicating that this effect is not correlated
with the role of TGFß in growth
inhibition. We did observe that p15 protein levels accumulated in TGFß exposed growth inhibited, but not resistant
HMEC. Measurement of p15 protein half-life showed it to be more stable in the
TGFß exposed growth inhibited cells (£34 vs. 8.5 hr). We hypothesize that the
observed increased binding of p15 to cdk4 and cdk6 in these cells stabilizes
the p15 protein. This binding correlated with loss of D1, p27 and p21
associated cdk4/6 and increased p27 association with E/cdk2 complexes.
We did not detect any inherent differences in the p15 protein in the inhibited
vs. resistant cells. p15 isolated from either could displace in vitro D1, p27
and p21 from cdk4 complexes isolated from inhibited cells. However, neither p15
could disrupt these preformed complexes from resistant cell lysates. It is
therefore most likely that the p15 differences in the inhibited vs. resistant
cells are secondary to a change in the D1/cdk4-6/p27/p21 complexes which alters
the ability of p15 to bind the cdk. It is also possible that an alteration in
p27 increases its affinity for cdk2 vs. cdk4-6.
VI. Other Properties of HMEC System
Index
Of the variety of studies we and others have done on these HMEC cultures, I
want to include two topics in this review that, at various times, have been the
subject of extensive investigation, and may be relevant to work of others.
VI.A. Metabolism of Chemical Carcinogens
(references: Stampfer et al., 1981; Bartley at al., 1982; Bartley and Stampfer,
1985, Leadon et al., 1988)
Index
Before we began the studies on BaP transformation of normal HMEC, we had
performed extensive studies on the capacity of human mammary epithelial and
fibroblastic cells to metabolize the PAH class of procarcinogens. PAH like BaP
require a series of metabolic steps for conversion of the inactive
procarcinogen into the active, ultimate carcinogenic form, the diol-epoxide,
which is capable of forming bulky adducts with DNA. Since the extent and
pattern of BaP metabolism can vary greatly among species, as well as among
different individuals and cell type within one specie, we examined the rate and
path of BaP metabolism in cells from many individuals.
Our results indicated that HMEC are extremely active in metabolizing BaP
through the pathways that lead to the 7,8-diol-9,10-epoxide, which can form
adducts with the deoxyguanosine of DNA. in contrast, the same concentration of
BaP given to fibroblast cells from the same person's breast tissue yielded a
much slower rate of metabolism, mainly through pathways that do not lead to the
diol-epoxide, and a much lower production of DNA adducts. At the time these
studies were performed, it was surprising to observe this high degree of PAH
metabolism by non-liver tissues. Whether this has any bearing on in vivo
transformation of HMEC is still unknown. Of possible note is the fact that the
breast consists largely of adipose tissue, in which the lipid soluble PAH can
concentrate. Comparisons of BaP metabolite products from 22 different specimen
donors showed around a 5-fold range in values. Thus, this is a situation where
individual variability needs to be considered. Additionally, we found that
culture conditions can significantly influence the metabolites formed. The
pattern of metabolites could vary with medium used (MM vs. MCDB 170), passage
level (pre- or post-selection MCDB 170 cells) and use of sub-optimal culture
conditions (confluent or overly acidic cell cultures).
We also showed that the damage resulting from BaP metabolism may be due to
oxidative damage as well as bulky adduct formation. We found that the lethal
effect of BaP correlated with the extent of thymine glycol formation (a measure
of oxidative damage) rather than bulky adduct formation, and could be reduced
by agents which protect against oxidative damage, such as superoxide dismutase.
VI.B. Calmodulin-Like Protein
(references, Yaswen et al., 1990; Yaswen et al., 1992; Edman et al., 1995)
Index
One approach we took to characterize the differences between our normal and
transformed HMEC cultures was to use subtractive hybridization to identify
genes that are expressed in the normal HMEC and are downregulated in the
immortal and malignantly transformed cells. Subtractive hybridization was
performed between the normal 184 cell cDNA and both 184B5 and B5KTu cell mRNA.
In addition to identifying fibronectin, keratin 5, and vimentin, a 350 base
pair cDNA fragment was isolated which initially showed no similarity to any
sequence reported in GenBank. This cDNA hybridized specifically to a 1.4 kb
mRNA, designated NB-1, which was expressed in normal HMEC, but was
downregulated (184B5) or undetectable (184A1) in the transformed cell lines.
Sequence analysis of a full length NB-1 clone revealed a 447 bp open reading
frame with extensive similarity (70%, 71%, and 80%) at the nucleic acid level
to the three known human genes coding for the ubiquitous calcium binding
protein, calmodulin. The similarity between the translated amino acid sequence
of NB-1 and human calmodulin was 85% over the length of the entire protein.
Using Northern and PCR analysis, NB-1 mRNA has been thus far found only in
normal epithelial cells and tissues from human breast, prostate, cervix, and
skin. It has not been found in normal epithelial cells other than those from
stratified or pseudo-stratified tissues. It was not detectable in
non-epithelial cells and tissues, nor in any of the mammary epithelial tumor
cell lines which we have examined. Human breast cells obtained from lactational
fluids were also negative for NB-1 expression by PCR analysis.
Expression of NB-1 mRNA is not significantly decreased when cells are growth
arrested by exposure to anti-EGF receptor antibodies or in senescing cells
where proliferation is minimal. It is increased in cells growth arrested by TGFß and reduced when HMEC are grown on
reconstituted extracellular matrix material.
Using antisera which displayed a strong preference for NB-1 protein over
calmodulin., the level of endogenous NB-1 protein in 184 HMEC was approximately
100-200 ng / 106 cells, a level similar to the estimated level of calmodulin in
other cultured cell lines. The relative abundance of the 16 kD NB-1 protein
(named calmodulin like protein, or CLP) reflected relative NB-1 mRNA levels in
various cell types. In contrast, levels of calmodulin protein were nearly
constant in the same cell extracts.
Using indirect immunoflourescence, CLP was shown to be present diffusely
throughout the cytoplasm and, to varying degrees, in the nuclei of 184
interphase cells. During mitosis, CLP was particularly bright in regions around
mitotic spindles. In 184B5, CLP expression was heterogeneous both among
different cells and within individual cells; no significant CLP
immunofluorescence was observed in 184A1. In surgical specimens from
histologically normal breast tissues, CLP staining was strong in the majority
of basal cells from small ducts. Luminal cells in the small ducts showed some
staining, although not as intense. In larger ducts, staining was mainly
confined to the basal cells and was generally less intense than in the small
ducts. In all cases, distribution of the protein appeared uniformly
intracellular. No staining was evident in basement membrane or stromal areas.
In contrast to normal breast tissue, sections from six infiltrating ductal
breast carcinomas were consistently negative for CLP expression. Serial
sections of the normal and tumor tissues all showed abundant calmodulin
expression.
CLP distribution has also been examined in other stratified and
pseudo-stratified epithelial tissue sections. In normal prostate, nearly all
the epithelial cells were stained to a similar degree. In normal cervix and
skin, no staining was observed in the basal cell layer. In the cervix,
suprabasal cells were intensely CLP positive, with the degree of staining
diminishing in the more distant upper layers. In the skin, the intensity of
staining increased from the suprabasal layer until the stratum corneum, which
itself was not stained. Thus, in the four different tissues examined, CLP
showed distinct patterns of expression. These results suggest that the role of
CLP may be defined by the differentiated state of the cells where it is
expressed.
An unusual feature of CLP genomic DNA is the absence of introns, whereas all
vertebrate calmodulin genes studied to date contain five similarly placed
introns. It is possible that CLP may be a rare example of an expressed
retroposon.
External calcium concentration has been shown to affect the proliferative
potential and differentiated states of some cultured epithelial cells,
including keratinocytes and mammary epithelial cells. In normal keratinocytes, increasing
calcium concentrations can lead to cessation of proliferation and expression of
markers of terminal differentiation, and loss of response to the calcium
induced differentiation signal has been shown to correlate with the early
stages of transformation. The downregulation of CLP expression observed after
in vitro and in vivo transformation of HMEC may reflect a consequence of, or a
requirement of the transformed state. Possibly, a particular state of
differentiation is required for transformation to occur, or the transformed
state may be incompatible with high expression of CLP.
VII. Information on HMEC Computer Records, Mailing Sheets, and
Distribution
Index
In order to accurately record both the many varieties of HMEC being used in my
lab, and the cell cultures distributed to others, it became acutely necessary
to develop appropriate record keeping practices. These have been threefold: (1)
A complex relational database for recording frozen cell culture inventories and
information; (2) A simple database for recording cell cultures distributed to
other laboratories and a newsletter and other informational material on cell
usage to be distributed along with the cells; (3) Standardized record keeping
formats for my lab. More details are presented below.
VII. A. Cell Inventory Database
Index
When I first starting collecting and freezing cell material in the days before
personal computers, records were maintained on index cards on rolodexes. This
was obviously not an ideal format, particularly as the number and complexity of
cell types increased. We acquired a PC in 1985 and I worked with a programmer
to develop a suitable inventory database using DBase. Since I am not familiar
with computer programming, DBase on a PC was not an optimal situation for me.
As soon as the Macintosh II and the 4th Dimension database were available in
1987, the existing program and records were transferred and refined. I worked
closely with a computer programmer to design the 4th Dimension program, which
is flexible enough to allow me to make adjustments in layout, data
organization, and ways to select and present data. More recently, we have been
able to have a computer programmer make major updates and improvements to this
program.
The database consists of two main related files. One file (Inventory) records
the complete identity of each frozen cell batch (identified by Specimen ID,
Cell, Tissue, Passage #, and, where relevant, also Type, Subtype, FreezeDown
Symbol and Selection), the number of ampoules of that batch which were made and
which remain, the location of that batch of ampoules in the freezer, and a
space for comments. Whenever cells are frozen, a test ampoule is included. When
the test (or the first ampoule of that batch) is removed it is scored for
viability, health, and the number of days it takes to reach confluence. This
information is then entered into the Inventory file (unfortunately, not all
batches have been tested, so sometimes I end up sending cells whose viability
has not been ascertained). All freeze downs are also tested for mycoplasma
contamination by Hoechst staining, and the results of this testing are entered
into the Inventory file. This program allows for easy selection and sorting on
any field.
The second file (Location) records the location of each individual ampoule.
When an ampoule is removed, it records and files the information on date,
purpose for removal, and who removed them. It also updates the Inventory file
records to indicate the reduced number of ampoules remaining.
In both files, all ampoules are identified by a 5 digit code, the FreezeDownNumber
(FDN) you see on the Mailing sheets I send. The purpose of this code is to
encapsulate all of the information above into 5 digits that can be easily
written on an ampoule and stored in a computer. IT DOES NOT BY ITSELF
IDENTIFY THE CELLS. PLEASE, DO NOT REFER TO THE CELLS BY THIS CODE! I
have no idea what cells you're talking about without checking the database.
These code numbers have even crept into publications - a truly confusing
situation. The cells should be referred to by their Specimen Identification,
Type, and Subtype (sent to you on the mailing sheets, see below).
VII. B. Cell Distribution Database
Index
I use simple databases I created in Panorama II to keep track of cells sent to
other investigators, (Recipients file) and to keep addresses and information
for the Newsletter (Newsletter file). The Recipients file generates the mailing
sheets that go along with the distributed HMEC. These databases allow for easy
selection on all fields. Figure 14 gives an example of these mailing sheets and
explanations of the categories.
Figure 16: Example of a HMEC Mailing sheet.
I started the Newsletters as the number of collaborations and those requesting
cells increased. Basically, I wanted to ensure that a certain level of
information about the cells was given to each investigator. Additionally, I
thought it might be helpful for all those using the same cell system to be
aware of what others labs were doing. Output of the Newsletters was rather
sporadic. One of the goals of this website is to replace the Newsletters. Thus,
this review is intended to provide the basic information (and more) that was in
the newsletters and in reviews that I would send to investigators requesting
cells. Additionally, methods for use of the cells (see Procedures) and the list of other investigators and
their research subjects is available (see HMEC
Investigators List).
VII. C. Cell Distribution
Index
Given the large numbers and types of cells available, I prefer to talk
individually with each person desiring cell cultures to determine what is most
appropriate for their needs. If you want cells, you will be asked to send a
brief (1 page) letter describing your planned experiments, and indicating that
(1) you will keep me informed of results or major changes in planned
experiments; (2) you will not give the cells to others without my permission.
Let me know in you want to be on the Investigators List, and if so, include all
the information as you would want it listed (including EMail address). There
are also legal forms from the University of California for you and your
institution to sign and return. I will require from you a FedEx number or
equivalent to charge the costs of shipping the cells. For shipments outside the
US, you will need to ensure that all proper customs forms and delivery
arrangements are made. We prefer to send out frozen cell cultures; these are
placed in dry ice and send overnight. We can also send live cells at room
temperature if absolutely necessary, but we seriously discourage this
alternative as it is much more work for us. A mailing sheet will be sent with
the cells (see above). We have not tested every freezedown (particularly the
more obscure) so occasionally we will be sending cells that have not been
tested for viability. I will note this on the mailing sheet. Otherwise, the
cells that are being sent are known to be capable of good growth under the
appropriate culture conditions.
General Cell Culture Reminders:
Taking care of normal human epithelial cells in culture bears some resemblance
to taking care of children - the cells may behave by their own logic and
timing, which may not coincide with that of the care provider. To optimize the
accuracy and consistency of experimental results, the cell's needs have to come
first. Some of the important things to remember for these HMEC:
(1) pH must be carefully controlled. The color of the pH indicator should be
around salmon-orange. Yellow indicates too acid conditions; in my experience
cells left at such acidity become irreversibly sick. The HMEC quickly acidify
the culture medium, particularly when near confluent. We change the medium
every 2 days (3 on weekends) and refeed a culture 24 hrs before subculture or
experimental usage. Your results may differ if you use cells that are acidic or
haven't been fed in a while.
(2) The cells do not stay healthily once they become confluent. They should be
subcultured when subconfluent or just confluent. We use subconfluent cultures
for most biochemical and molecular studies. Your results may differ if you use
confluent (non-proliferating) cultures.
(3) Some cell biology changes as a function of age in culture. It is best to
repeat experiments using cells at around the same passage level, with the same
life expectancy. This is also a good practice for the cell lines, which may
change over extended periods of time in culture. Your results may differ if you
use cells at very different passage levels.
(4) It's really helpful to look at the cells frequently, to become familiar
with how they appear under different circumstances. An enormous amount of
useful information can be gleaned simply by careful visual observation. If
something doesn't look right, it probably isn't, and should be investigated
immediately.
ABBREVIATIONS USED:
Index
BaP: benzo(a)pyrene
CFE: colony forming efficiancy
CKI: cyclin dependent kinase inhibitor
CLP: calmodulin like protein
EGF: epidermal growth factor
EGFR: epidermal growth factor receptor
ENU: N-nitroso-ethyl-urea
GSE: genetic suppressor element
HMEC: human mammary epithelial cells
HPV: human papilloma virus
LI: labeling index
p: passage
PaH: polycyclic aromatic hydrocarbon
PD: population doublings
PEM: polymorphic epithelial mucin
RB: retinoblastoma
TRF: terminal restriction fragment
PUBLICATIONS/REFERENCES
Index
Bartley, JC, Bartholomew, JC, Stampfer, MR, Metabolism of Benzo(a)pyrene in Human Mammary Epithelial and Fibroblast Cells: Metabolite Pattern and DNA Adduct Formation. J. Cell. Biochem. 18:135-148, 1982.
Bartley, JC, Stampfer, MR, Factors influencing benzo(a)pyrene metabolism in human mammary epithelial cells. Carcinogenesis 6:1017-1022, 1985.
Bates, SE, Valverius, E, Ennis, BW, Bronzert, DA, Sheridan, JP, Stampfer, M,
Mendelsohn, J, Lippman,
ME, Dickson, RB, Expression of the TGFa/EGF receptor pathway in normal human
breast epithelial cells. Endocrin. 126: 596-607, 1990.
Brenner, AJ, Stampfer, MR, Aldaz, M, Increased p16 expression with first senescence arrest in human mammary epithelial cells and extended growth capacity with inactivation, Oncogene, 17:199-205, 1998.
Clark, R, Stampfer, M, Milley, B, O'Rourke, E, Walen, K, Kriegler, M, Kopplin, J, McCormick, F, Transformation of human mammmary epithelial cells by oncogenic retroviruses. Cancer Res. 48:4689-4694, 1988.
Dairkee, SH, Deng, G., Stampfer, MR, Waldman, FM, Smith, HS, Selective cell culture of primary breast carcinoma, Cancer Res. 55:2516-1519, 1995.
Frittitta, L, Vigneri, R, Stampfer, MR, Goldfine, ID, Insulin receptor overexpression in 184B5 human mammary epithelial cells induces a ligand-dependent transformed phenotype, J. Cell. Biochem. 57:666-669, 1995.
Garbe, J, Wong, M, Wigington, D, Yaswen, P, Stampfer, MR, Viral oncogenes accelerate conversion to immortality of cultured conditionally immortal human mammary epithelial cells, Oncogene, 18:2169-2180, 1999.
Hammond, SL, Ham, RG, and Stampfer, MR, Serum-free growth of human mammary epithelial cells: Rapid clonal growth in defined medium and extended serial passage with pituitary extract. PNAS (USA) 81:5435-5439, 1984.
Hosobuchi, M, Stampfer, MR, Effects of Transforming Growth Factor-ß on growth of human mammary epithelial cells. In Vitro 25:705-713, 1989.
Leadon, SA, Stampfer, MR, Bartley, J, Production of thymine glycols during the metabolism of benzo(a)-pyrene by human mammary epithelial cells. Proc. Natl. Acad. Sci. (USA), 85:4365-4368, 1988.
Lehman T, Modali R, Boukamp P, Stanek, J., Bennett, WP, Welsh, JA, Metcalf, RA, Stampfer, MR, Fusenig, N, Rogan, EM, Reddel, R, Harris, CC, p53 mutations in human immortalized epithelial cell lines. Carcinogenesis 14, 833-839, 1993.
Nijjar, T, Wigington, D, Garbe, JC, Waha, A, Stampfer, MR, Yaswen, P, p57KIP2 expression and loss of heterozygosity during immortal conversion of cultured human mammary epithelial cells, Cancer Res,:59, 5112-5118, 1999.
Nonet, GH, Stampfer, M., Chin, .,Gray, JW, Collins, CC, and Yaswen, P, The ZNF217 Gene amplified in breast cancers promotes immortalization of human mammary epithelial cells, Cancer Res. 61: 1250-1254, 2001.
Romanov, SR, Kozakiewicz, K, Holst, CR, Stampfer, MR, Haupt, LM, and Tlsty, TD, Normal human mammary epithelial cells spontaneously escape senescence and acquire genomic changes, Nature, 409:633-637, 2001.
Sandhu, C, Garbe, J, Bhattacharya, N, Daksis, J, Pan, C-H, Yaswen, P, Koh, J, Slingerland, JM, Stampfer, MR, TGF-b increases p15INK4B protein and p15INK4B/cdk4 complexes and prevents cyclin D1/cdk4 association in human mammary epithelial cell, Mol. Cell Biol. 17:2458-2467, 1997.
Slingerland, JM, Hengst, L, Pan, C-H., Alexander, D, Stampfer, MR, Reed, SI, A novel inhibitor of cyclin/cdk activity detected in TGF-b arrested cell, Molecular Cell Biology 14: 3683-3694, 1994.
Stampfer, MR, Hallowes, R, and Hackett, AJ, Growth of normal human mammary epithelial cells in culture. In Vitro 16:415-425, 1980.
Stampfer, M.R., Vlodavsky, I., Smith, H.S., Ford, R., Becker, F.F., and Riggs, J., Fibronectin production by human mammary cells. J. Natl. Cancer Inst. 67:253-261, 1981.
Stampfer, MR, Bartholomew, JC, Smith, HS, and Bartley, J, Metabolism of benzo(a)pyrene by human mammary epithelial cells: Toxicity and DNA adduct formation. PNAS. (USA) 78:6251-6255, 1981.
Stampfer, MR, Cholera toxin stimulation of human mammary epithelial cells in culture. In Vitro 18:531-537, 1982.
Stampfer, M, Bartley, JC, Induction of transformation and continuous cell lines from normal human mammary epithelial cells after exposure to benzo(a)pyrene. PNAS. (USA) 82:2394-2398, 1985.
Stampfer, M.R., Isolation and Growth of Human Mammary Epithelial Cells. J. Tissue Culture Methods 9:107-116, 1985.
Stampfer, MR, Yaswen, P, Factors influencing growth and differentiation of normal and transformed human mammary epithelial cells in cultures. In: G.E. Milo, B.C. Castro, C.F. Shuler (eds.), Transformation of Human Epithelial Cells: Molecular and Oncogenetic Mechanisms, 117-140. CRC Press, 1992.
Stampfer, MR, Yaswen, P, Alhadeff, M, Hosoda, J, TGFb induction of extracellular matrix associated proteins in normal and transformed human mammary epithelial cells in culture is independent of growth effects. J. Cell. Physiol. 155, 210-221, 1993.
Stampfer, MR, Pan, C-H, Hosoda, J, Bartholomew, J, Mendelsohn, J, Yaswen, P, Blockage of EGF receptor signal transduction causes reversible arrest of normal and immortal human mammary epithelial cells with synchronous reentry into the cell cycle. Exp. Cell Res. 208: 175-188, 1993.
Stampfer, MR and Yaswen, P, Culture Models of Human Mammary Epithelial Cell Transformation, J. Mam. Gland Bio. Neo. 5:365-378, 2000.
Stampfer, MR, Bodnar, A, Garbe, J, Wong, M, Pan, A, Villeponteau, B, Yaswen, P, Gradual phenotypic conversion associated with immortalization of cultured human mammary epithelial cells, Mol. Biol. Cell 8:2391-2405, 1997.
Stampfer, MR, Garbe, J, Levine, G, Lichtsteiner, S, Vasserot, AP, and Yaswen, P, hTERT expression can induce resistance to TGFb growth inhibition in p16INK4A(-) human mammary epithelial cells, Proc. Natl. Acad. Sci. (USA), 2001.
Stampfer, MR and Yaswen, P, Immortal transformation and telomerase reactivation of human mammary epithelial cells in culture, in: Advances in Cell Aging and Gerontology, Volume: Aging and Disease, editors M.P. Mattson and T. Pandita, 2001.
Taylor-Papadimitriou, J, Stampfer, M, Bartek, J, Lewis, A, Boshell, M, Lane, E., Leigh, IM, Keratin expression in human mammary epithelial cells cultured from normal and malignant tissue: Relation to in vivo phenotypes and influence of medium. J. Cell Sci. 94:403-413,1989.
Tlsty, TD, Romanov, SR, Kozakiewicz, BK, Holst, C R, Haupt, LM, Crawford, YG, Loss of chromosomal integrity in human mammary epithelial cells subsequent to escape from senescence. J. Mammary Gland Biol Neoplasia, 6: 235-243, 2001.
Thompson, EW, Torri, J, Sabol, M, Sommers, CL, Byers, S, Paik, S, Martin, GR, Lippman, ME, Valverius, E, Stampfer, MR, Dickson, RB, Oncogene-induced basement membrane invasiveness in human mammary epithelial cells, Clin. Exp. Metast. 12:181-194, 1994.
Walen, KH, Stampfer, MR, Chromosome analyses of human mammary epithelial cells (HMEC) at stages of chemically-induced transformation progression to immortality. Cancer Genet. Cytogen.. 37:249-261, 1989.
Yaswen, P, Smoll, A, Hosoda, J, Parry, G, Stampfer, MR, Protein product of a human intronless calmodulin-like gene shows tissue-specific expression and reduced abundance in transformed cells. Cell Growth & Diff., 3: 335-345, 1992.
Yaswen, P, Smoll, A, Peehl, D, Trask, DK, Sager, R, and Stampfer, MR, Downregulation of a novel calmodulin-related gene during transformation of human mammary epithelial cells. Proc. Natl. Acad. Sci. USA, 87:7360-7364, 1990.
Yaswen, P, Stampfer, MR, Ghosh, K, Cohen, JS, Effects of sequence of thioated oligonucleotides on cultured human mammary epithelial cells. Antisense Research and Development 3, 67-77, 1993.
Yaswen, P, and Stampfer, MR, Epigenetic changes accompanying human mammary epithelial cell immortalization, J. Mam. Gland Bio. Neo. 6: , 2001.
Section I. D.
Chang, S. E., and Taylor-Papadimitriou, J., Modulation of phenotype in
cultures of human milk epithelial cells and its relation to the expression of a
membrane antigen, Cell Diff. 12:143, 1983.
Bartek, J., Taylor-Papadimitriou, J., Miller, N., and Millis, R., Pattern of
expression of keratin 19 as detected with monoclonal antibodies to human breast
tumors and tissues, Int. J. Cancer 36:299, 1985.
Bartek, J., Durban, E. M., Hallowes, R. C., and Taylor-Papadimitriou, J., A
subclass of luminal epithelial cells in the human mammary gland, defined by
antibodies to cytokeratins, J. Cell Sci. 75:17, 1985.
Taylor-Papadimitriou, J., Millis, R., Burchell, J., Nash, R., Pang, L., and
Gilbert, J., Patterns of reaction of monoclonal antibodies HMFG-1 and -2
with benign breast tissues and breast carcinomas, J. Exp. Pathol. 2:247,
1986.
Guelstein, V. I., Tchypysheva, T. A., Ermilova, V. D., Litvinova, L. V.,
Troyanovsky, S. M., and Bannikov, G. A., Monoclonal antibody mapping of
keratins 8 and 17 and of vimentin in normal human mammary gland, benign tumors,
dysplasias and breast cancer, Int. J. Cancer 42:147, 1988.
Rudland, P. S., and Hughes, C. M., Immunocytochemical identification of cell
types in human mammary gland: Variations in cellular markers are dependent on
glandular topography and differentiation, J. Histochem. Cytochem. 37:1087,
1989.
Petersen, O. W., Hoyer, P. E., and van Deurs, B., Frequency and distribution
of estrogen receptor-positive cells in normal, non-lactating human breast
tissue, Cancer Res. 47:5748, 1987. Ricketts, D., Turnbull, L., Ryall, G.,
Bakhshi, R., Rawson, N. S. B., Gazet, J.-C., Nolan, C., and Coombes, R. C., Estrogen
and progesterone receptors in the normal human breast, Cancer Res. 51:1817,
1991.
Section II. B.
Pierce, J. H., Arnstein, P., DiMarco, E., Artrip, J., Kraus, M. H., Lonardo,
F., DiFiore, P. P., Aaronson, S. A., Oncogenic potential of erbB-2 in human
mammary epithelial cells. Oncogene 6:1189-1194, 1991.
Zhai Y-F, Beittenmiller H, Wang B, et al. Increased expression of specific
protein tyrosine phosphatases in human breast epithelial cells neoplastically
transformed by the neu oncogene. Cancer Res. 53:2272-2278, 1993.
Section II. C.
Eldridge SR and Gould MN, Comparison of spontaneous mutagenesis in
early-passage human mammary cells from normal and malignant tissues. International
J. Cancer 50:321-324, 1992.
Eldridge SR, Martens TW, Sattler CA and Gould MN, Association of decreased
intercellular communication with the immortal but not the tumorigenic phenotype
in human mammary epithelial cells. Cancer Res. 49:4326-4331, 1989.
Delmolino, L., Band, H., Band, V., Expression and stability of p53 protein
in normal human mammary epithelial cells. Carcinogeneisis 14: 827-832,
1993.
Band, V., Dalal, S., Delmolino, L., Androphy, E. J., Enhanced degradation of
p53 protein in HPV-6 and BPV-1 E6-immortlaized human mammary epithelial cells. EMBO
J. 12: 1847-1852, 1993.
Section III.C.
Garbe, J., Wong, M., Wigington, D., Yaswen, P., Stampfer, M.R., Viral
oncogenes accelerate conversion to immortality of cultured conditionally
immortal human mammary epithelial cells, Oncogene, 18, 2169-2180, 1999.
Section IV.
K. Keyomarsi, Sandoval, L., Band, V., Pardee, A.B. Synchronization of tumor
and normal cells from G1 to multiple cell cycles by lovastatin. Cancer Res.
51: 3602-3609, 1991.
Section VI.A.
A. Tischler, G. Levine, J.C. Bartley, Metabolism of benzo(a)pyrene and benzo(a)pyrene-7,8-dihydrodiol
in human mammary epithelial cells: feedback inhibition by
7-hydroxybenzo(a)pyrene. Carcinogenesis 12: 1539-1543, 1991.
Section VI.B.
Edman, C.F., George, S.E., Means, A.R., Schulman, H., and Yaswen, P. Selective
activation and inhibition of calmodulin dependent enzymes by a calmodulin-like
protein found in human epithelial cells. Eur. J. Biochem. 226: 725-730,
1994.
Harris, E., Yaswen, P., and Thorner J. Gain-of-function mutations in a human
calmodulin-like protein identify residues critical for calmodulin action in
yeast. Mol. Gen. Genetics 247:137-147, 1995.
ACKNOWLEDGEMENTS
Index
This web site was developed with support from the Department of the Army,
contract MIPR# MM4530EVJ. This research is currently supported by NIH grant
CA-24844, and the Office of Energy Research, Office of Health and Environmental
Research, U.S. Department of Energy under Contract No. DE-AC03-76SF00098.
Previous support has come from NIH grant CA-54247 (to Paul Yaswen), NIH grant
CA-30028 (to Richard Ham) and ACS grant PDT-72.
My thanks to the many colleagues who have worked on these projects over the
years, including Paul Yaswen, Junko Hosoda, Jack Bartley, Richard Ham, Joyce
Taylor-Papadimitriou, Joyce Slingerland, Adeline Hackett, Helene Smith, Richard
Hallowes, Bob Dickson, and Marc Lippman; postdoctoral fellows: Jim Garbe,
Myriam Alhadeff, Shelley Blam, Eva Valverius, Susan Bates; research associates
and students: Annie Pang, Kristy Venstrom, Kari Kozdin, Dori Hosobuchi,
Chin-Huei Pan, Michelle Wong, Gerri Levine, Don Wigington, Amy Smoll, Theresa
Sloma, Brenda Ringel, Ted Leonido, Linda Hayashi, Laura Horn, Tarlochan Nijjar,
and Susan Hammond, who developed MCDB 170. Thanks to Tony Rose, Tod Wolfarth,
Juveria Abdul-Aleem, Don Wigington and Dariel Cobb for the technical work and
implementation of this web page.
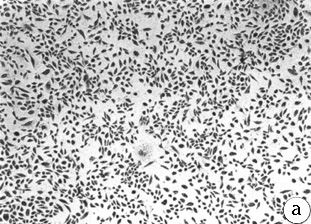
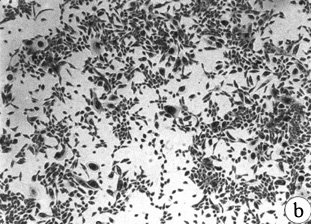
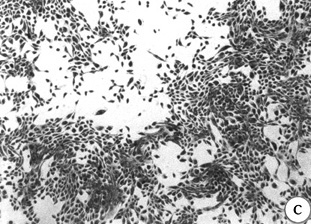
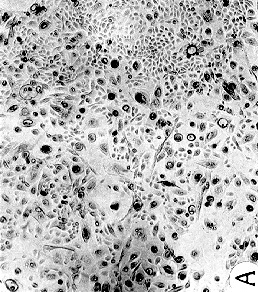
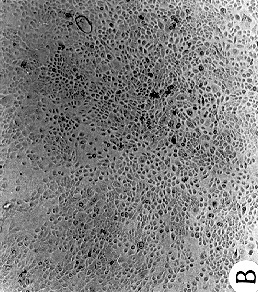
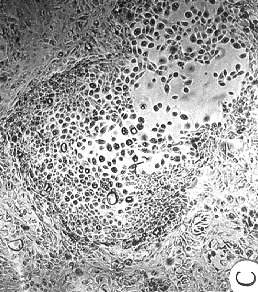
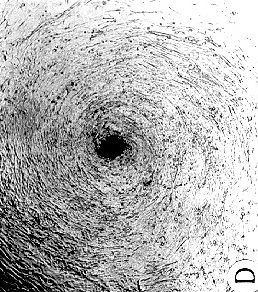
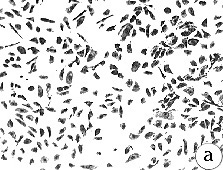
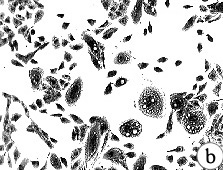
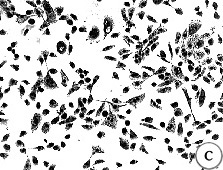
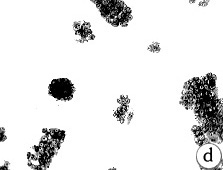
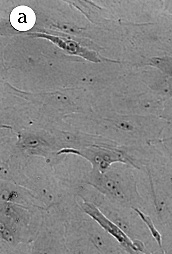
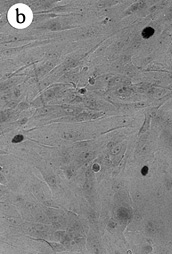
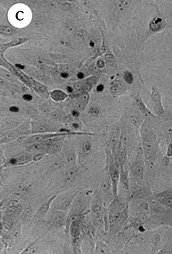
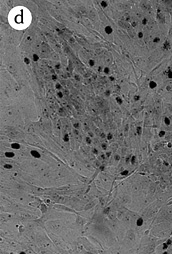
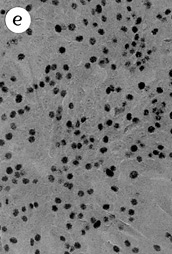
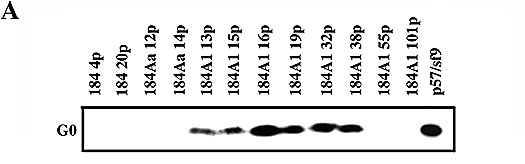
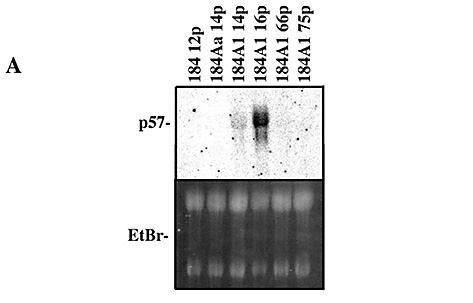
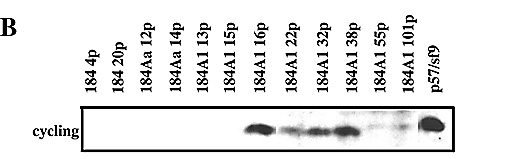